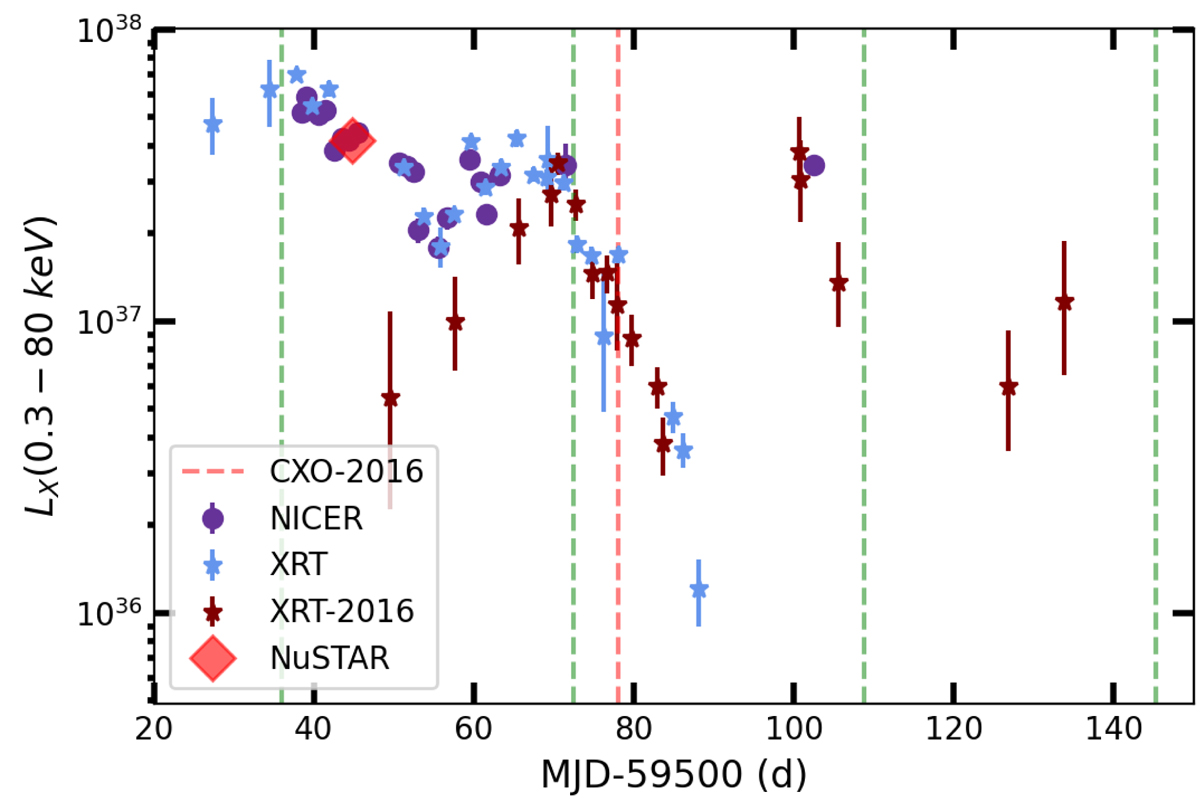
Fig. 3.
Download original image
X-ray light curves of the 2016 and 2021 outbursts. Luminosities are absorption corrected (0.3–80.0 keV) and computed for the SMC distance. Archival data from 2016 (first point at MJD 57547) are shifted in time to match the 2021 luminosity peaks. Vertical green lines mark the 36.411 d optical period phased on the first X-ray maximum. For comparison we also show the shifted epoch of the Chandra ToO that falls around the same orbital phase as the NuSTAR ToO.
Current usage metrics show cumulative count of Article Views (full-text article views including HTML views, PDF and ePub downloads, according to the available data) and Abstracts Views on Vision4Press platform.
Data correspond to usage on the plateform after 2015. The current usage metrics is available 48-96 hours after online publication and is updated daily on week days.
Initial download of the metrics may take a while.