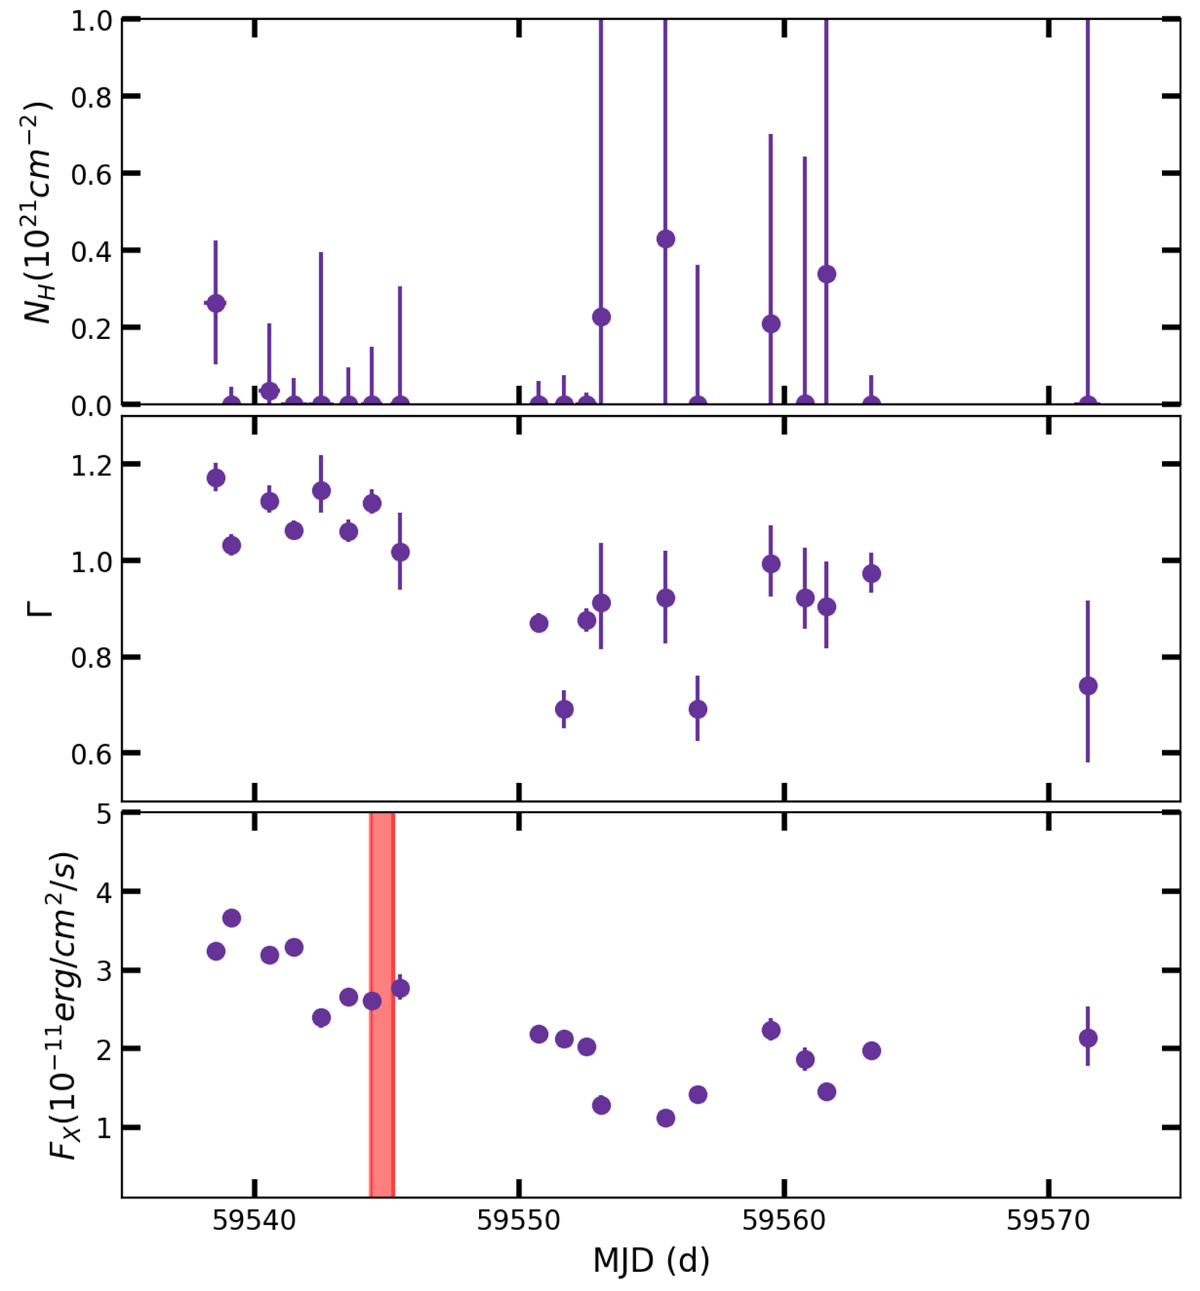
Fig. 2.
Download original image
Spectral results of NICER monitoring data obtained during the 2021 outburst of SXP 15.6. The bottom panel shows the unabsorbed flux computed in the 0.3–10.0 keV band. The red shaded region indicates the epoch of the NuSTAR ToO. No strong evidence for a change in the column density of the absorbing material (top panel) is seen, but we found evidence of spectral evolution at higher fluxes with the spectral shape (characterised by Γ, middle panel) becoming softer when brighter above 2× 10⁻¹¹ erg cm−2 s−1 (0.3–10.0 keV).
Current usage metrics show cumulative count of Article Views (full-text article views including HTML views, PDF and ePub downloads, according to the available data) and Abstracts Views on Vision4Press platform.
Data correspond to usage on the plateform after 2015. The current usage metrics is available 48-96 hours after online publication and is updated daily on week days.
Initial download of the metrics may take a while.