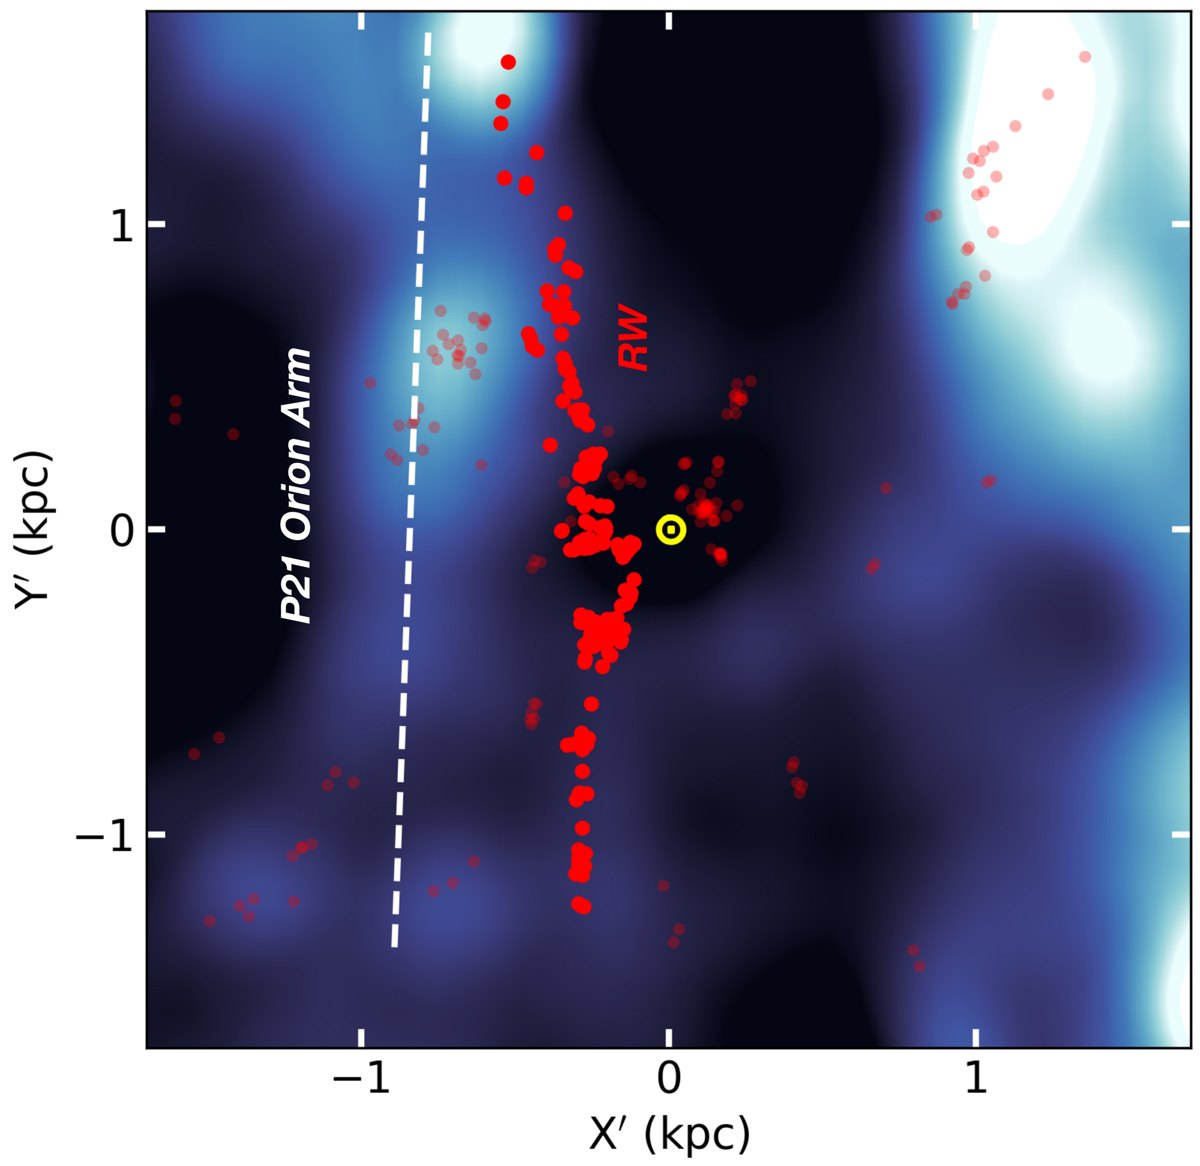
Fig. 2.
Download original image
Zoomed and rotated version of Fig. 1 displaying the Z21 stellar over- and under-density (in black, blue, and white) and star-forming region locations (Zucker et al. 2020) in red, with the bold-red points marking clouds belonging to the Radcliffe wave. The dashed white line shows the fit to the over-density peaks along the P21 Orion arm. The Sun is located at the center in yellow.
Current usage metrics show cumulative count of Article Views (full-text article views including HTML views, PDF and ePub downloads, according to the available data) and Abstracts Views on Vision4Press platform.
Data correspond to usage on the plateform after 2015. The current usage metrics is available 48-96 hours after online publication and is updated daily on week days.
Initial download of the metrics may take a while.