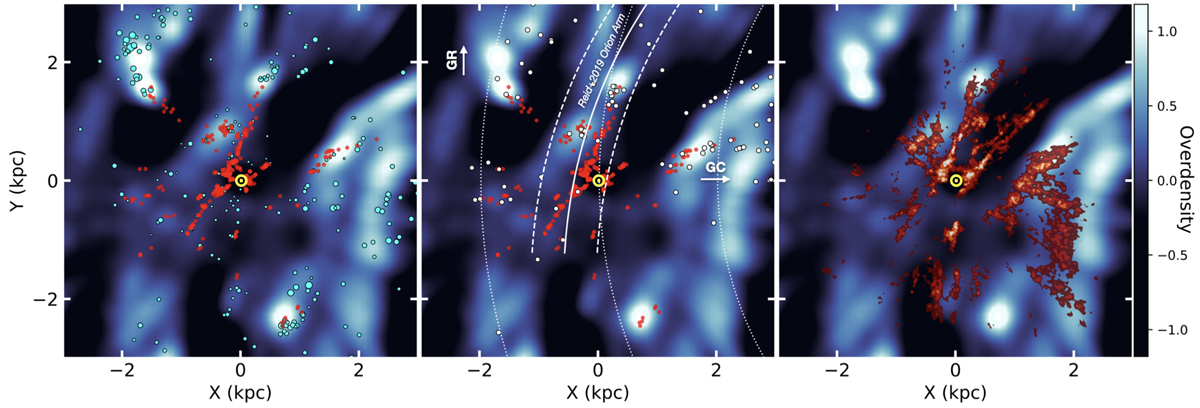
Fig. 1.
Download original image
Galactic XY (bird’s-eye) view of various stellar and dust distributions within ∼4.25 kpc of the Sun (centered yellow dot). The over-density map of the OBA-type stars from Zari et al. (2021) (in black, blue, and white) is shown in the background of each panel. The emergent spiral features in this map, from decreasing to increasing values in X, are the Perseus, Orion, and Sagittarius-Carina arms. The star-forming clouds from Zucker et al. (2020) are displayed as red points in the first two panels, with the Radcliffe wave appearing as a narrow alignment of clouds from (X, Y)≈(−1, −1) kpc to (X, Y)≈(0.5, 2) kpc. The cyan points in the first panel are the open clusters from Cantat-Gaudin et al. (2020) with ages of less than 30 Myr and sized relative to the square root of their membership count. The second panel shows the masers (white points) and the fit to the Orion (local) arm (solid white line) from Reid et al. (2019), along with the fit’s width represented by the two dashed white lines. The second panel also displays three circles of constant, Galactocentric radius (dotted white lines) and two arrows pointing in the directions of the Galactic center and Galactic rotation. Overlaid in the third panel is the dust map of Lallement et al. (2019), with a heat map color-scale showing increasing dust density.
Current usage metrics show cumulative count of Article Views (full-text article views including HTML views, PDF and ePub downloads, according to the available data) and Abstracts Views on Vision4Press platform.
Data correspond to usage on the plateform after 2015. The current usage metrics is available 48-96 hours after online publication and is updated daily on week days.
Initial download of the metrics may take a while.