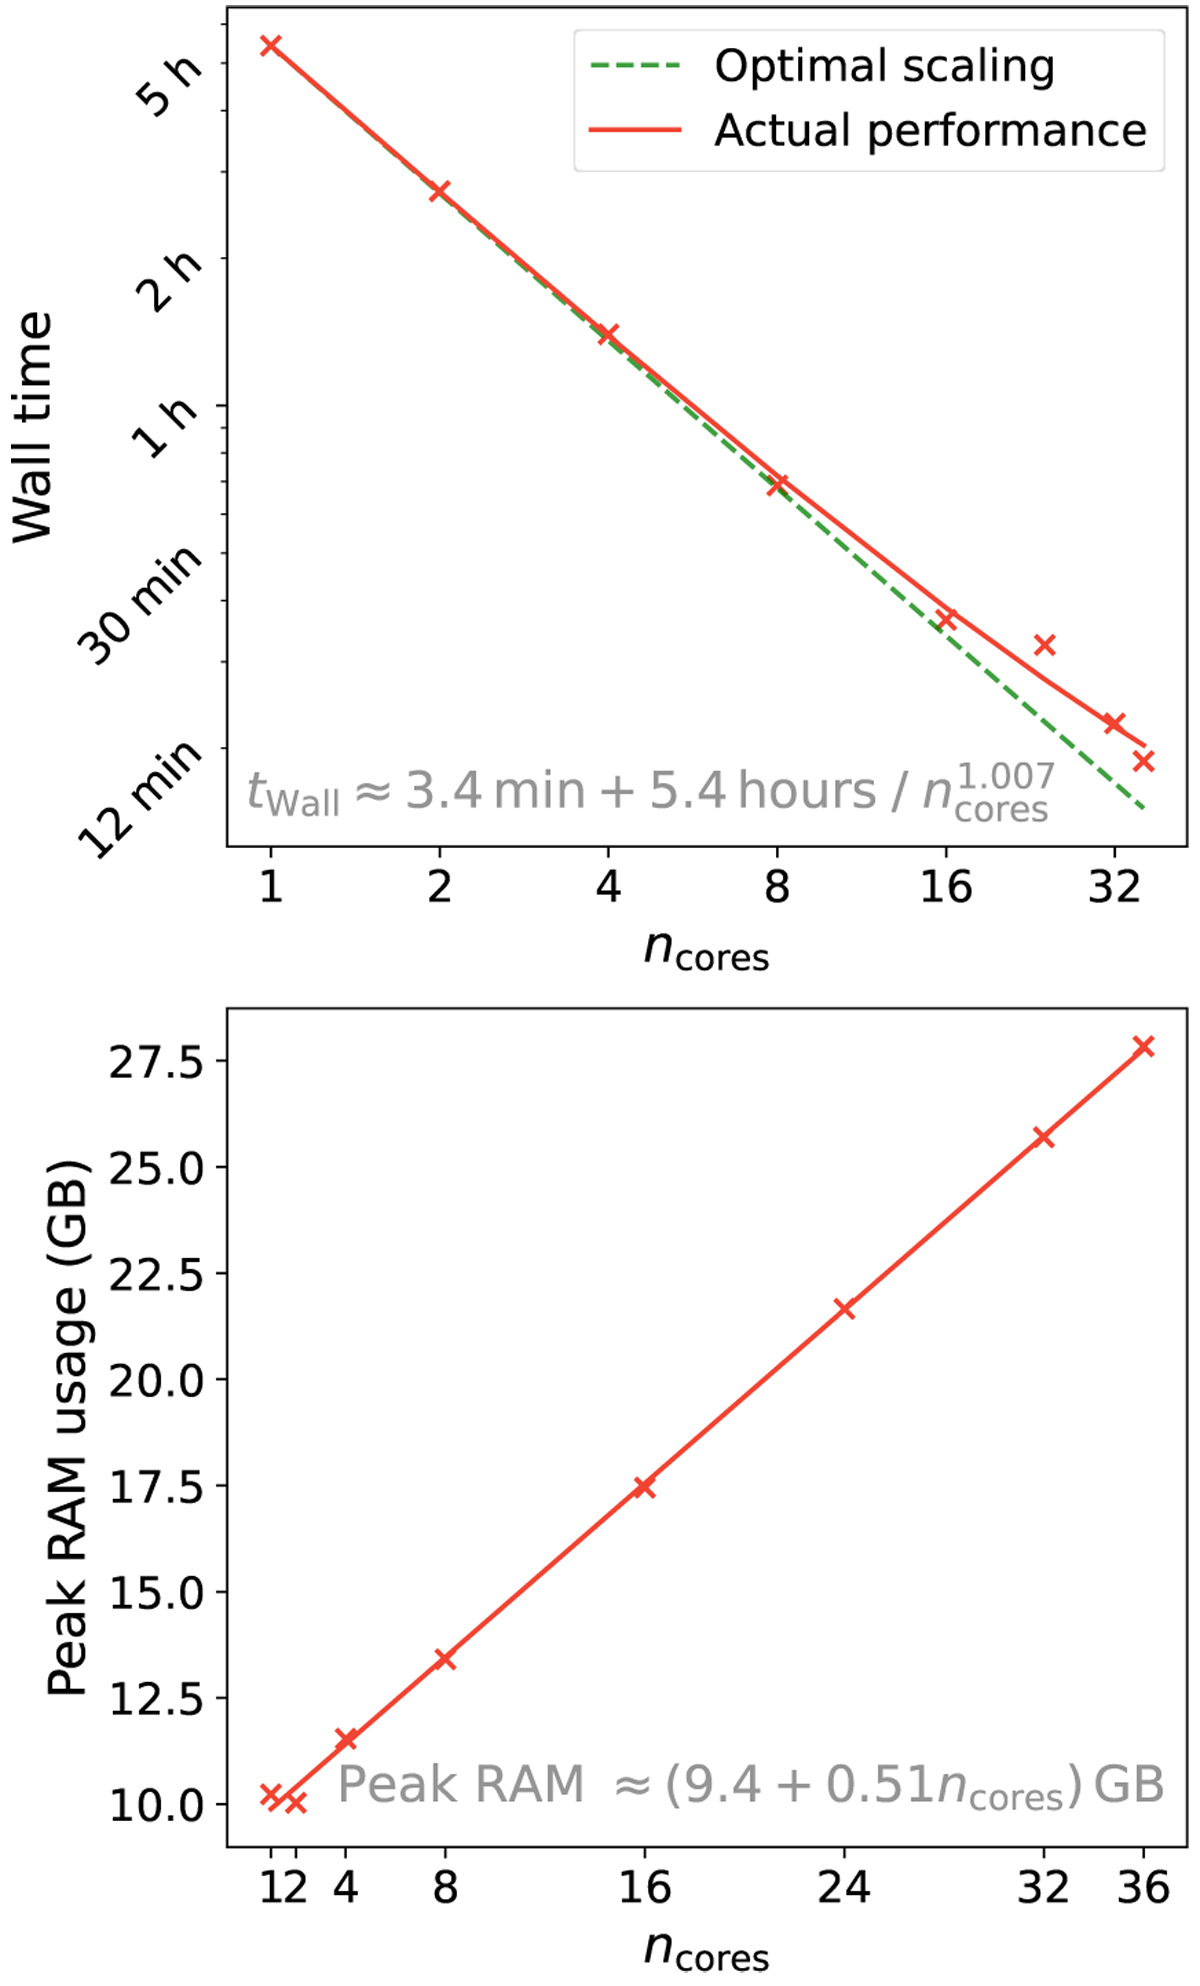
Fig. 9
Download original image
Parallel performance of ASOHF. Upper panel: scaling of the wall time of ASOHF in Test 4.5a (see Table 3) when the number of OMP threads is varied. The solid red line is a fit of the benchmark data (red crosses), and the dashed green line corresponds to an optimal scaling i.e. twall ∝ 1 /ncores. Lower panel: peak memory usage of ASOHF scaling with the number of OMP threads.
Current usage metrics show cumulative count of Article Views (full-text article views including HTML views, PDF and ePub downloads, according to the available data) and Abstracts Views on Vision4Press platform.
Data correspond to usage on the plateform after 2015. The current usage metrics is available 48-96 hours after online publication and is updated daily on week days.
Initial download of the metrics may take a while.