Fig. 8
Download original image
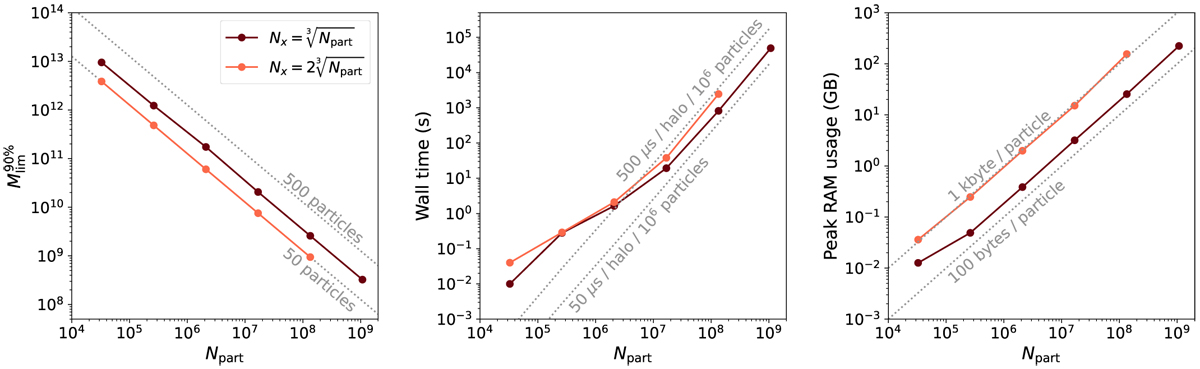
Summary of the results from the scalability test (Sect. 3.4.1). Left panel: scaling of the 90% completeness limit (in terms of mass) with the number of particles in the domain. Dashed grey lines correspond to a constant number of particles. Dark red (light red) lines represent the results for the two base grid sizes according to the legend. Middle panel: scaling of the wall time taken by ASOHF with number of particles. Dashed grey lines correspond to a scaling ![]() Right panel: scaling of the maximum RAM used ASOHF with number of particles. Dashed grey lines correspond to a constant amount of RAM per particle.
Right panel: scaling of the maximum RAM used ASOHF with number of particles. Dashed grey lines correspond to a constant amount of RAM per particle.
Current usage metrics show cumulative count of Article Views (full-text article views including HTML views, PDF and ePub downloads, according to the available data) and Abstracts Views on Vision4Press platform.
Data correspond to usage on the plateform after 2015. The current usage metrics is available 48-96 hours after online publication and is updated daily on week days.
Initial download of the metrics may take a while.