Fig. 7
Download original image
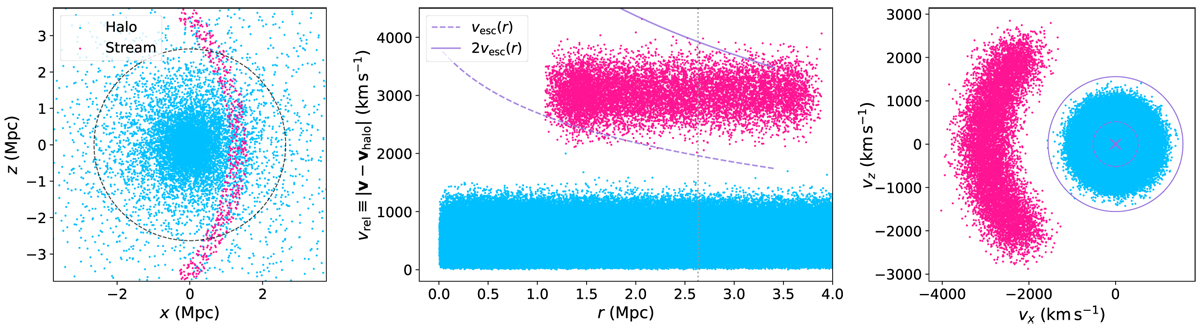
Results from Test 3b (unbinding). Left panel: particles in a 20 kpc slice through the centre of the halo. Blue (pink) dots refer to halo (stream) particles. The dashed grey circle corresponds to the location of the input virial radius. Middle panel: vral – r phase plot, with the same colour coding as in the previous panel, showing that the local escape velocity unbinding does not succeed in pruning the stream. Right panel: vz – vx phase space, keeping the colour coding as in the previous plots. The purple cross, dashed circle, and solid circle indicate the converged centre-of-mass velocity and the 1σv and 3σv regions, respectively. Particles outside the latter are pruned by the velocity space unbinding.
Current usage metrics show cumulative count of Article Views (full-text article views including HTML views, PDF and ePub downloads, according to the available data) and Abstracts Views on Vision4Press platform.
Data correspond to usage on the plateform after 2015. The current usage metrics is available 48-96 hours after online publication and is updated daily on week days.
Initial download of the metrics may take a while.