Fig. 3
Download original image
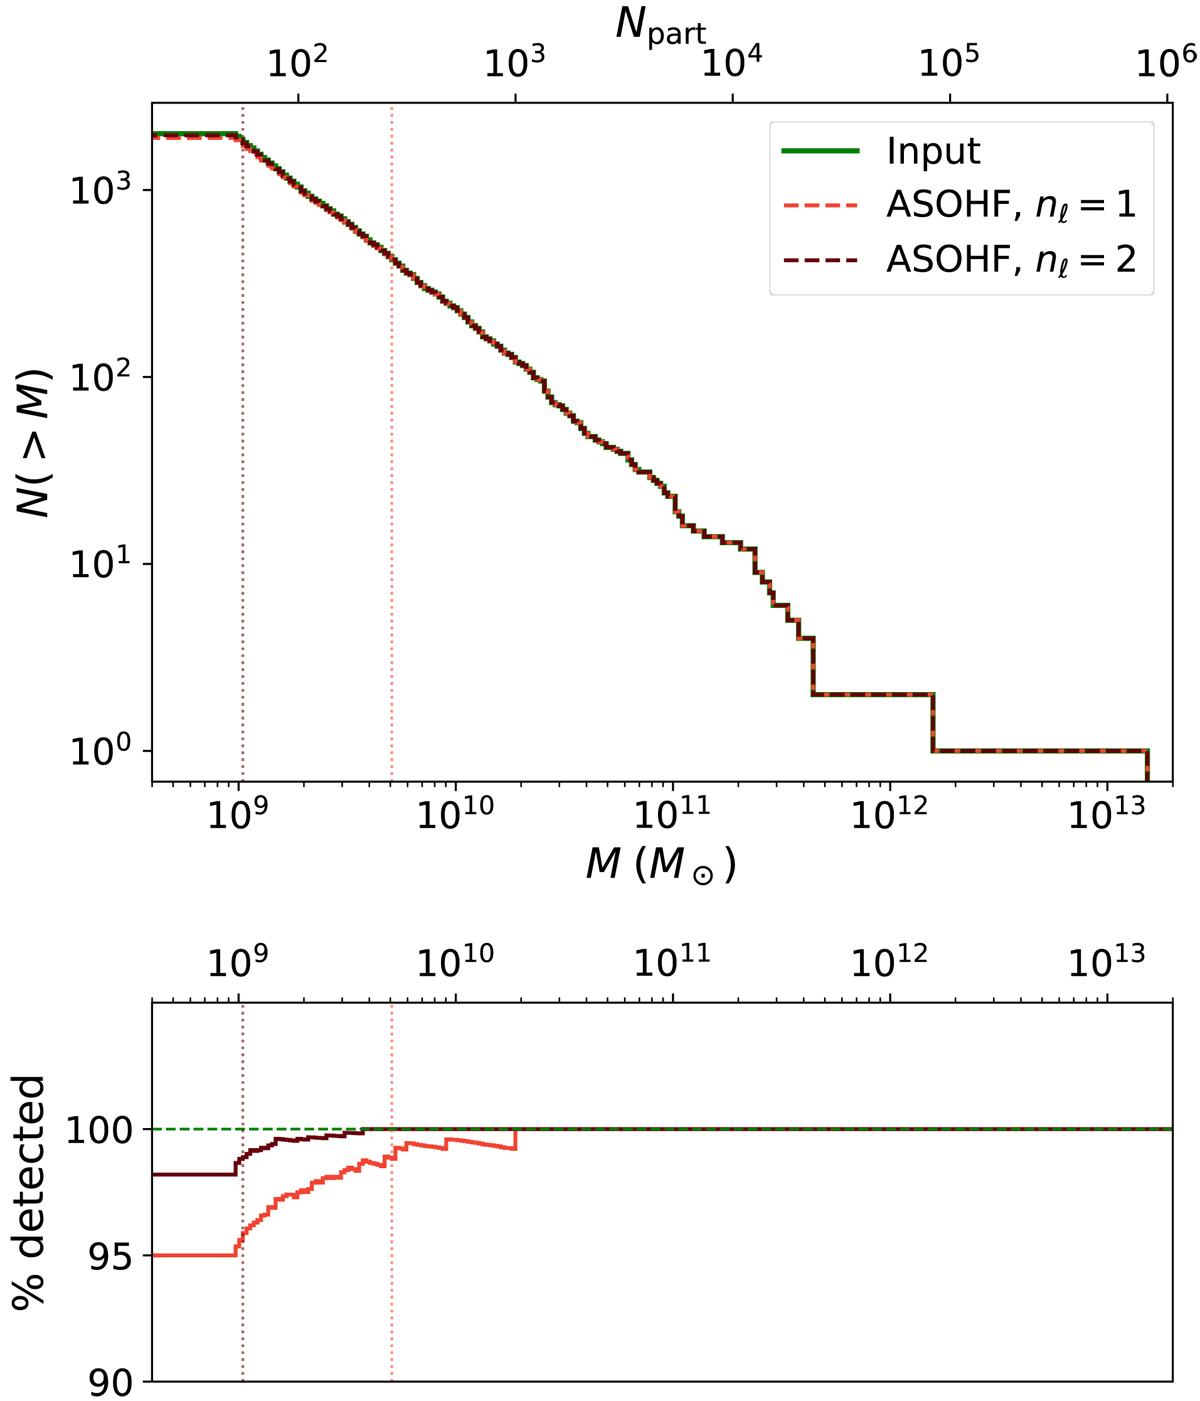
Results from Test 2. Upper panel: input substructure cumulative mass function (green line) compared to ASOHF results with nℓ = 1 (red) and nℓ = 2 (dark red). The vertical lines mark the completeness limit, this time at 99%, of the catalogue produced by ASOHF. Bottom panel: fraction of substructures with input mass higher than M detected by ASOHF, with the same colour codes as above.
Current usage metrics show cumulative count of Article Views (full-text article views including HTML views, PDF and ePub downloads, according to the available data) and Abstracts Views on Vision4Press platform.
Data correspond to usage on the plateform after 2015. The current usage metrics is available 48-96 hours after online publication and is updated daily on week days.
Initial download of the metrics may take a while.