Fig. 2
Download original image
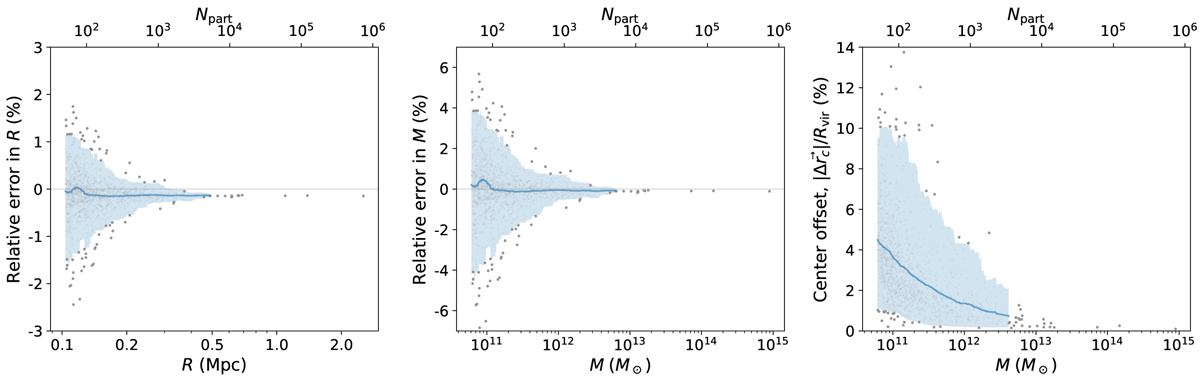
Precision of ASOHF in recovering basic halo properties in Test 1, with Nx = 256. In each panel, dots represent individual haloes, the blue line presents the smoothed trend by using a moving median, and the shaded region encloses the 2σ confidence interval around it. Left panel: relative error in the determination of the virial radius. Middle panel: relative error in the determination of the virial mass. Right panel: centre offset, in units of the virial radius.
Current usage metrics show cumulative count of Article Views (full-text article views including HTML views, PDF and ePub downloads, according to the available data) and Abstracts Views on Vision4Press platform.
Data correspond to usage on the plateform after 2015. The current usage metrics is available 48-96 hours after online publication and is updated daily on week days.
Initial download of the metrics may take a while.