Fig. 13
Download original image
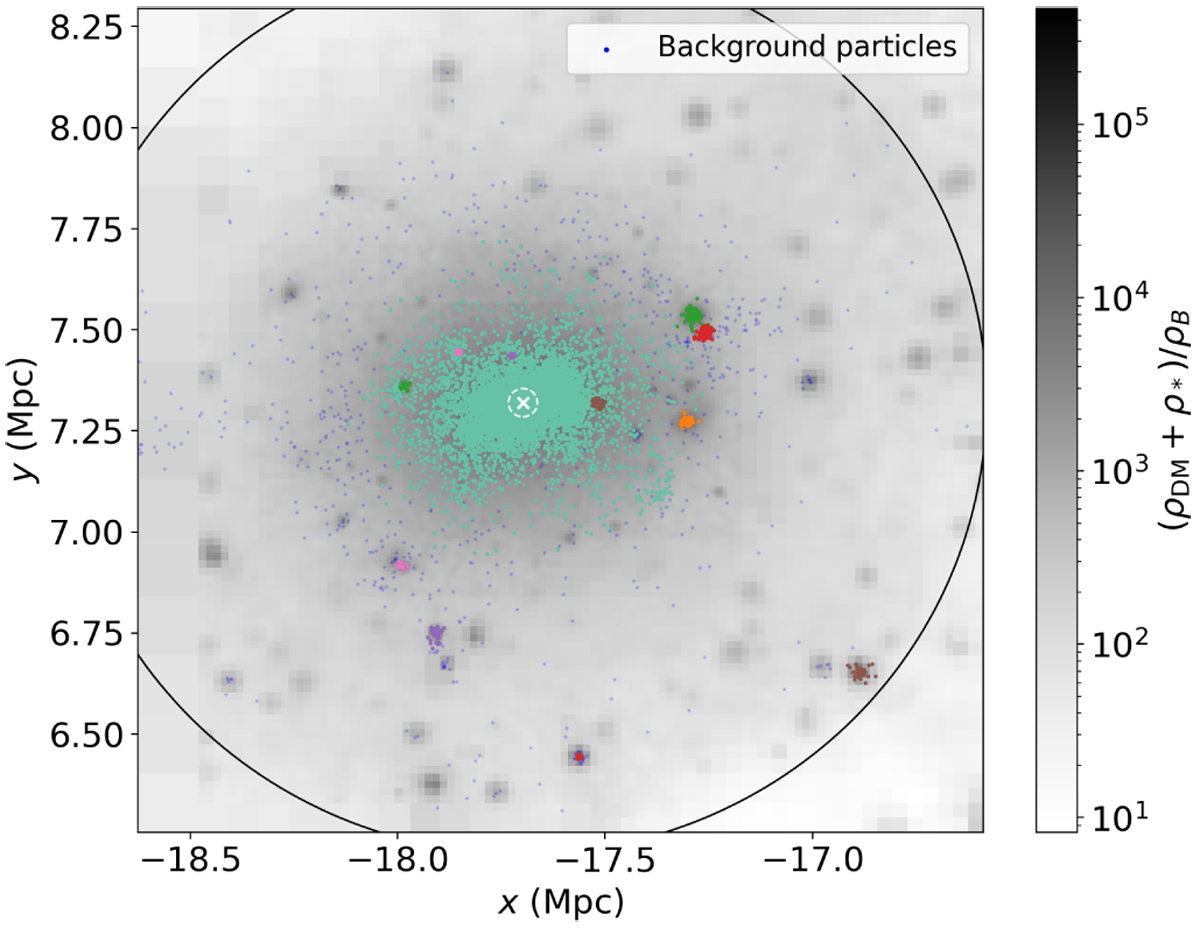
Example of the stellar halo finding capabilities of ASOHF. The background greyscale colour map is a projection of DM+stellar density around the most massive halo in the simulation. The solid black line indicates its virial radius. The coloured dots correspond to stellar particles, and each colour corresponds to a different stellar halo. The dark blue dots are the particles inside the virial volume of the DM halo that do not belong to any identified stellar structure. For the central galaxy, the white cross and circle represent the stellar density peak (which we regard as centre) and the half-mass radius of the stellar halo, respectively.
Current usage metrics show cumulative count of Article Views (full-text article views including HTML views, PDF and ePub downloads, according to the available data) and Abstracts Views on Vision4Press platform.
Data correspond to usage on the plateform after 2015. The current usage metrics is available 48-96 hours after online publication and is updated daily on week days.
Initial download of the metrics may take a while.