Fig. 10
Download original image
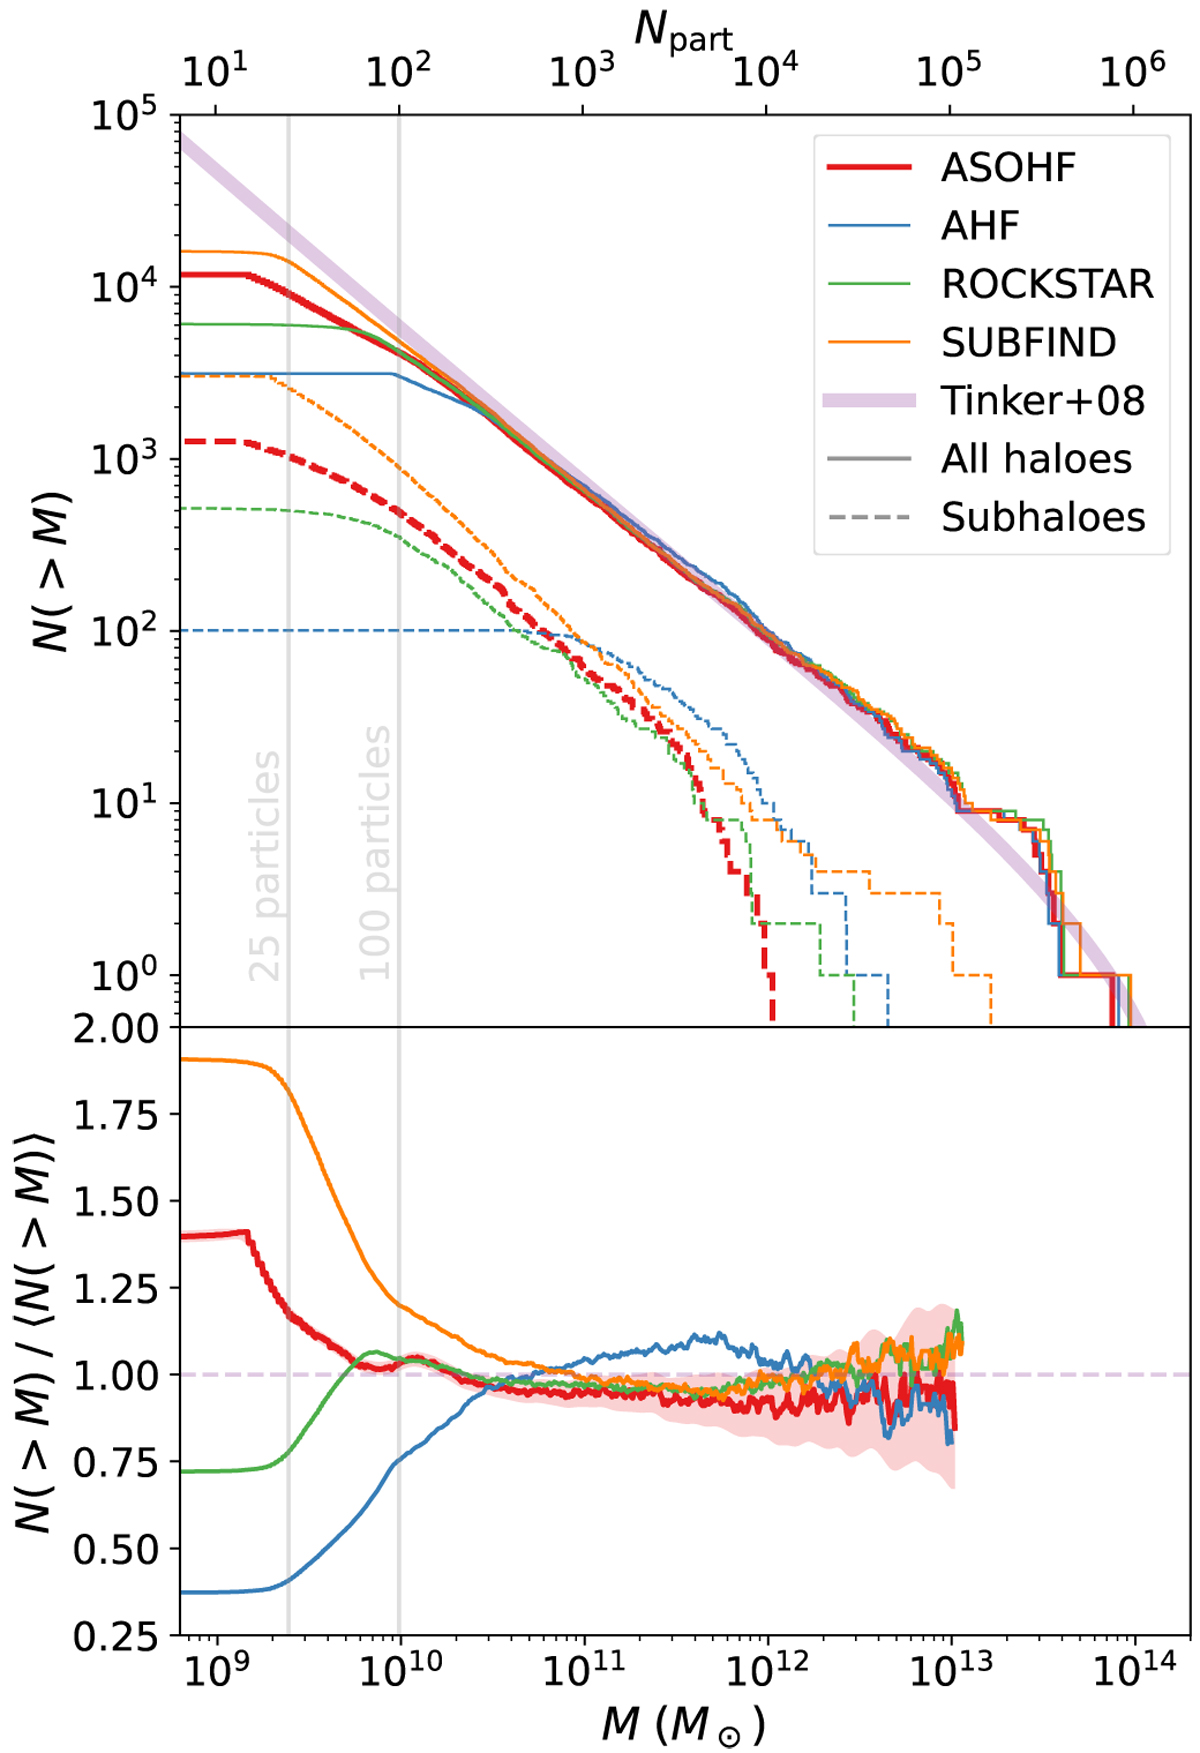
Comparison of the mass functions of the halo catalogues obtained by ASOHF (red), AHF (blue), Rockstar (green), and Subfind (orange) in the CAMELS Illustris–TNG LH–1 simulation at z = 0. Upper panel: mass functions obtained by each code, as solid lines. The thick purple line corresponds to a Tinker et al. (2008) mass function at z = 0 and with the cosmological parameters of the simulation for reference. Dashed lines present the mass function of subhaloes in the same colour scale. Lower panel: mass function of non-substructure haloes, normalised by the geometric mean of this statistic for the four halo finders. The shadow on the red line (ASOHF) corresponds to ![]() errors in halo counts. The errors are similar for the other finders.
errors in halo counts. The errors are similar for the other finders.
Current usage metrics show cumulative count of Article Views (full-text article views including HTML views, PDF and ePub downloads, according to the available data) and Abstracts Views on Vision4Press platform.
Data correspond to usage on the plateform after 2015. The current usage metrics is available 48-96 hours after online publication and is updated daily on week days.
Initial download of the metrics may take a while.