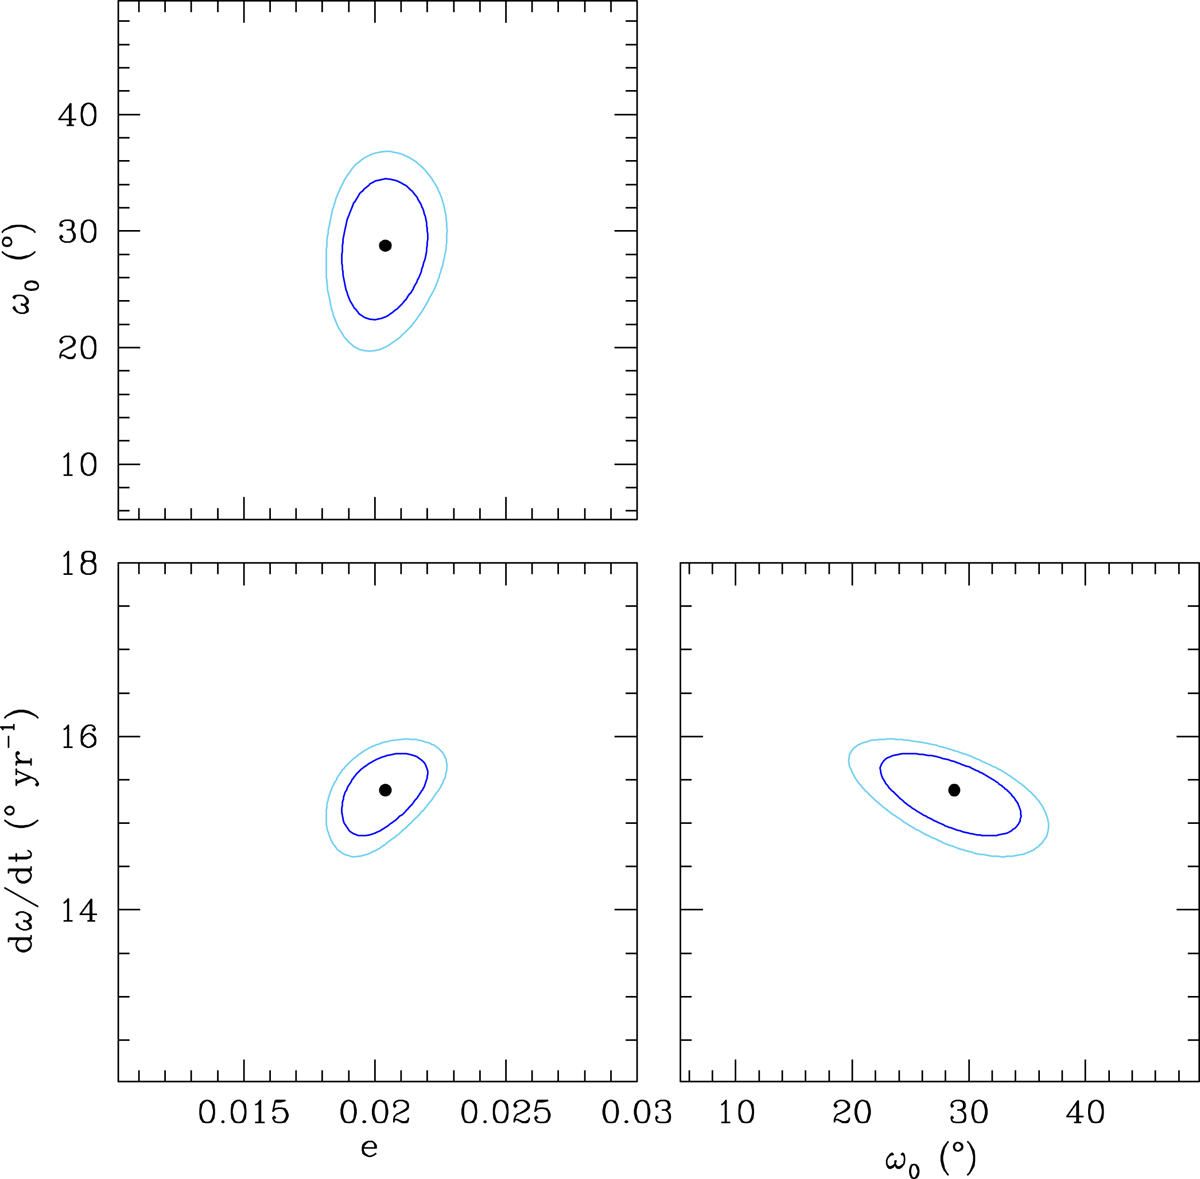
Fig. 9.
Download original image
Confidence contours for the best fit obtained from the adjustment of the phase differences between the times of the secondary and primary eclipses using Eq. (3). The best-fit solution is shown in each panel by the black filled dot. The corresponding 1σ and 99% confidence levels are shown by the dark and light blue contours, respectively.
Current usage metrics show cumulative count of Article Views (full-text article views including HTML views, PDF and ePub downloads, according to the available data) and Abstracts Views on Vision4Press platform.
Data correspond to usage on the plateform after 2015. The current usage metrics is available 48-96 hours after online publication and is updated daily on week days.
Initial download of the metrics may take a while.