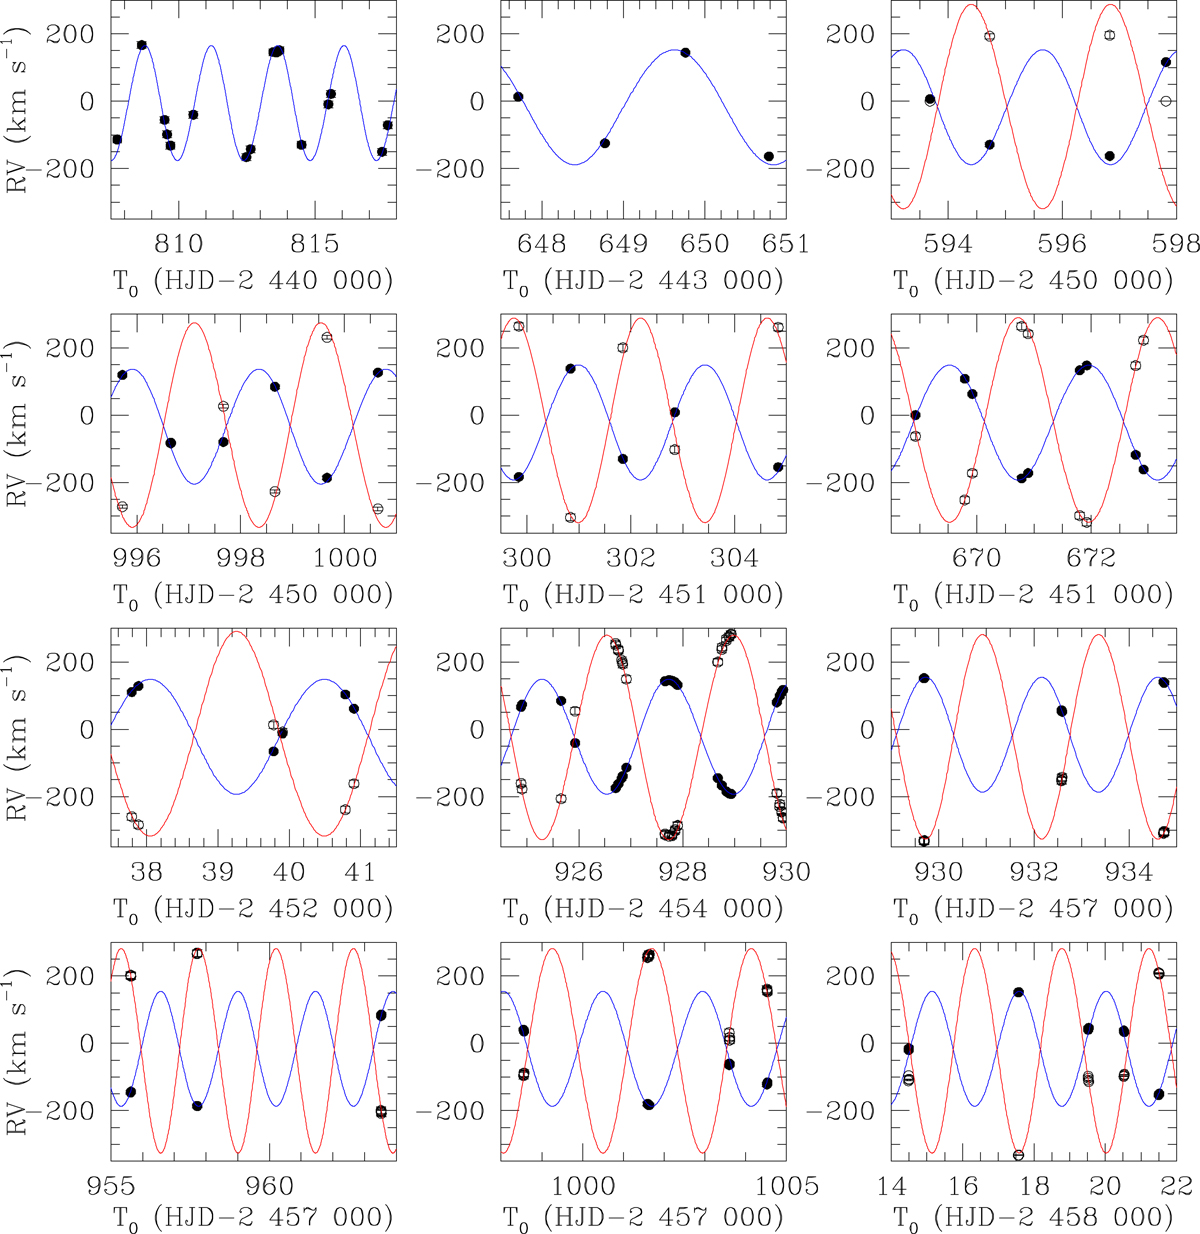
Fig. 5.
Download original image
Comparison between the measured RVs of the primary (filled dots) and secondary (open dots, when available) of CPD-41° 7742 with the orbital solution from Table 4. The blue and red lines represent the fitted RV curve of the primary and secondary stars, respectively. Top panels: data from Hill et al. (1974, left), Levato & Morrell (1983, middle), and García & Mermilliod (2001, right). Second row, left panel: yields the CAT/CES data from Sana et al. (2003). All other panels correspond to RVs derived in this paper.
Current usage metrics show cumulative count of Article Views (full-text article views including HTML views, PDF and ePub downloads, according to the available data) and Abstracts Views on Vision4Press platform.
Data correspond to usage on the plateform after 2015. The current usage metrics is available 48-96 hours after online publication and is updated daily on week days.
Initial download of the metrics may take a while.