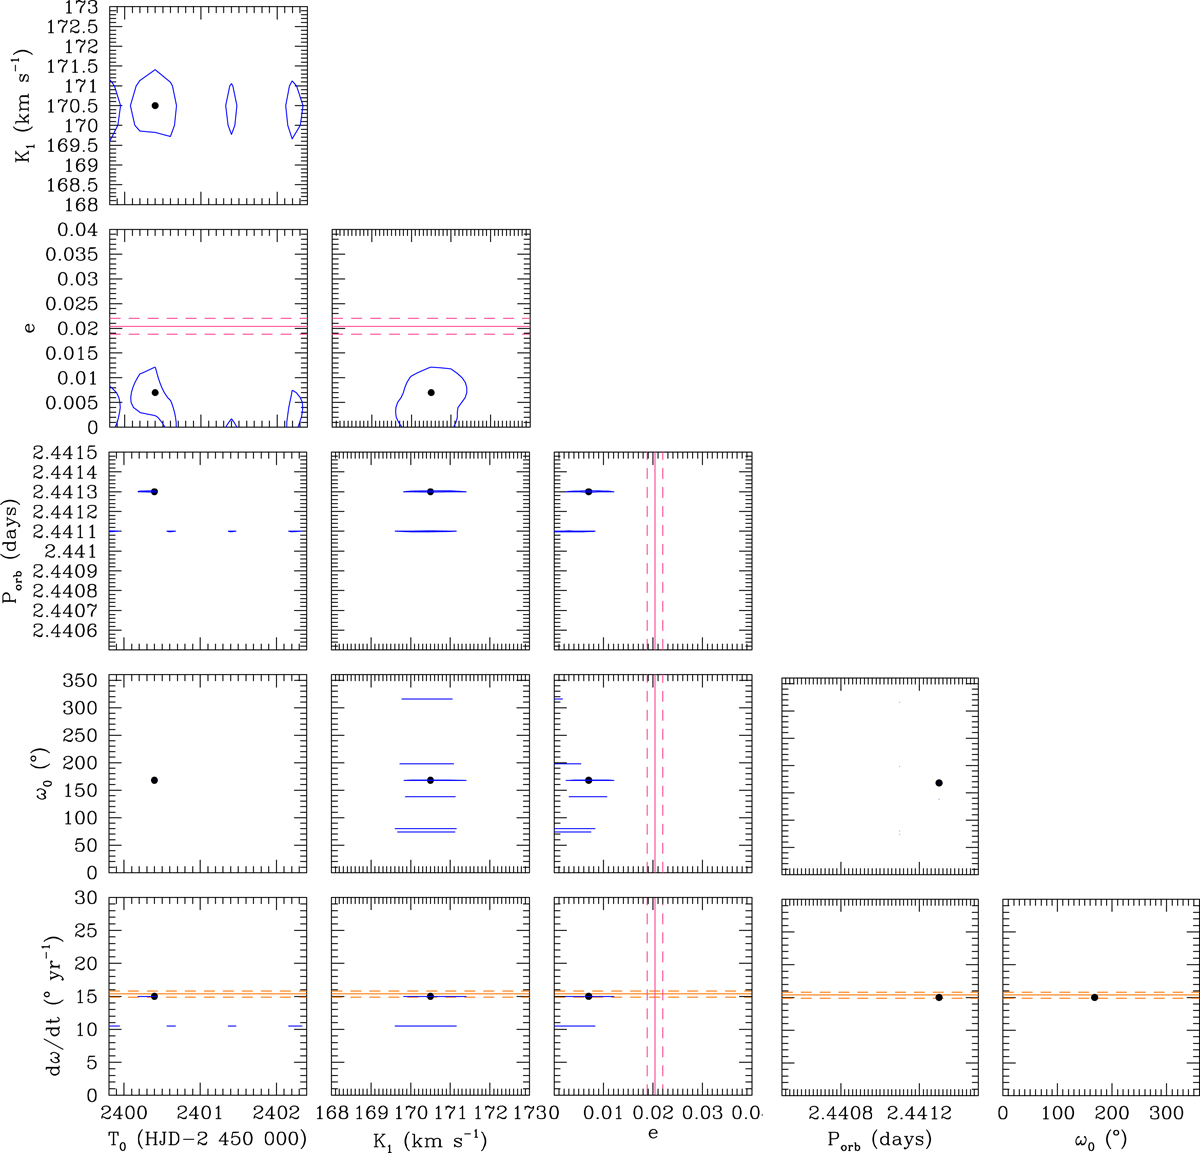
Fig. 3.
Download original image
Confidence contours for the best-fit parameters obtained from the adjustment of the primary RV data of CPD-41° 7742. The best-fit solution is shown in each panel by the black filled dot. The corresponding 1σ confidence level is shown by the blue contour. For comparison, the value of the apsidal motion rate (respectively eccentricity) and its error bars as derived in Sect. 6 are shown in orange (respectively pink) respectively by the solid and dashed lines.
Current usage metrics show cumulative count of Article Views (full-text article views including HTML views, PDF and ePub downloads, according to the available data) and Abstracts Views on Vision4Press platform.
Data correspond to usage on the plateform after 2015. The current usage metrics is available 48-96 hours after online publication and is updated daily on week days.
Initial download of the metrics may take a while.