Fig. 8.
Download original image
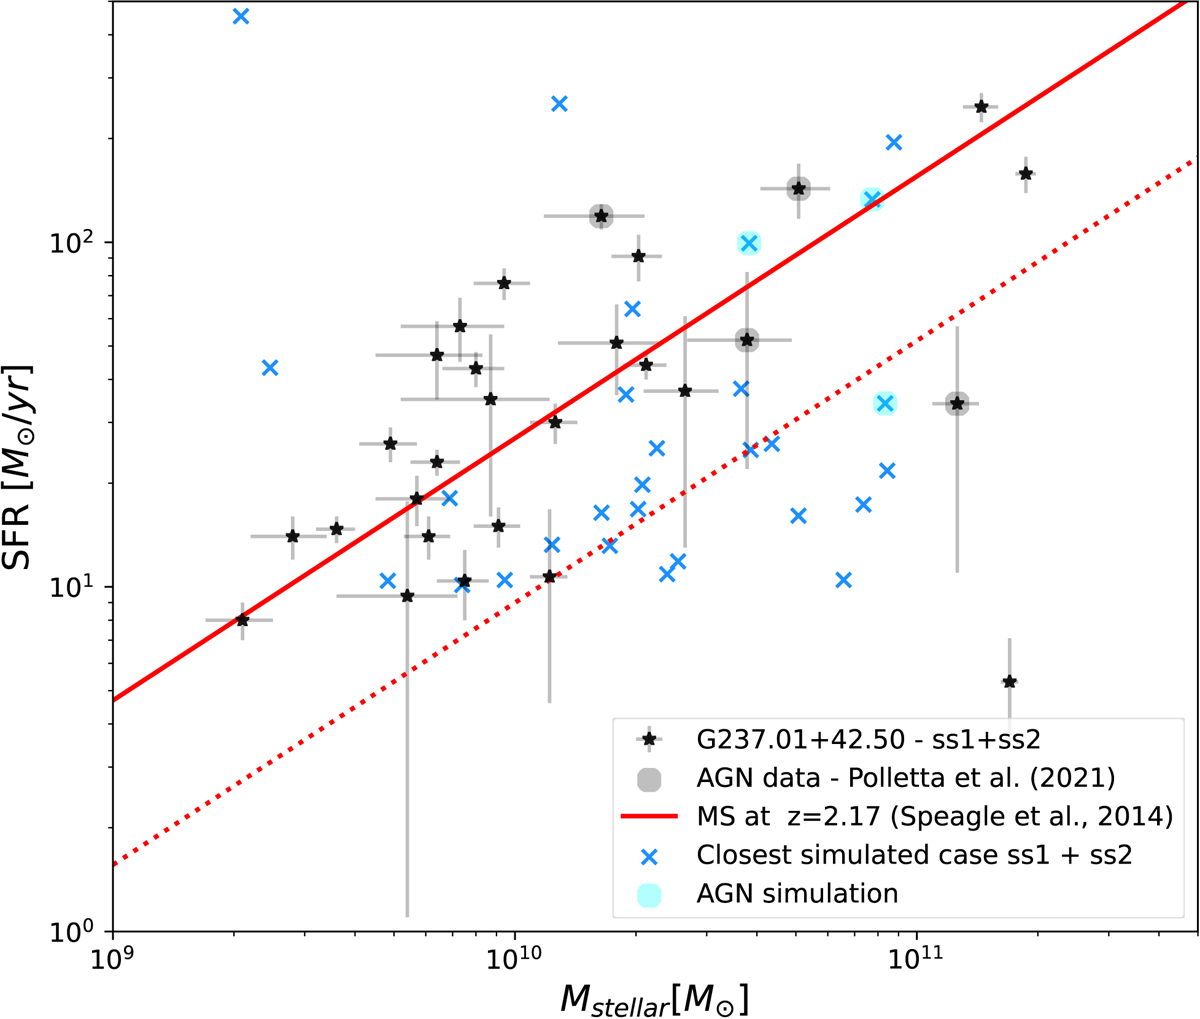
Star formation rates as a function of stellar masses of the galaxy members in the spectroscopically confirmed structure G237+42.50 (ss1+ss2) from Polletta et al. (2021) (black stars). A grey circle indicates the AGN members. The SFR and stellar masses of the galaxies from the closest simulated case (for ss1 and ss2) are shown as blue crosses, and a cyan circle is over-plotted on those that are considered AGN. The main sequence at z = 2.17, as formulated by Speagle et al. (2014), is shown as a solid red line, and the main sequence divided by a factor of three as a dotted red line.
Current usage metrics show cumulative count of Article Views (full-text article views including HTML views, PDF and ePub downloads, according to the available data) and Abstracts Views on Vision4Press platform.
Data correspond to usage on the plateform after 2015. The current usage metrics is available 48-96 hours after online publication and is updated daily on week days.
Initial download of the metrics may take a while.