Fig. 3
Download original image
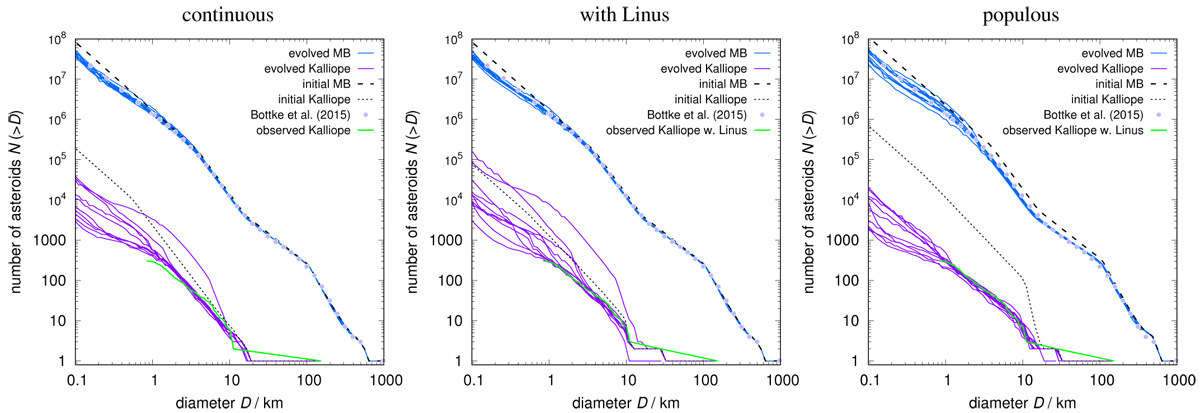
Collisional evolution of the main belt (blue) and the Kalliope family (pink). Cumulative size-frequency distributions N(>D) are plotted. The observed main belt population is taken from Bottke et al. (2015) and the observed Kalliope family from this work (green). We assumed three different initial conditions (black dashed): a continuous size-frequency distribution (left), with Linus and depleted D > 10 km bodies (middle), and a populous distribution (right). Each simulation was run ten times (multiple pink lines) in order to account for the stochasticity of collisions. The respective best-fit ages are 800 Myr, 900 Myr, and up to 3.4 Gyr.
Current usage metrics show cumulative count of Article Views (full-text article views including HTML views, PDF and ePub downloads, according to the available data) and Abstracts Views on Vision4Press platform.
Data correspond to usage on the plateform after 2015. The current usage metrics is available 48-96 hours after online publication and is updated daily on week days.
Initial download of the metrics may take a while.