Fig. 5.
Download original image
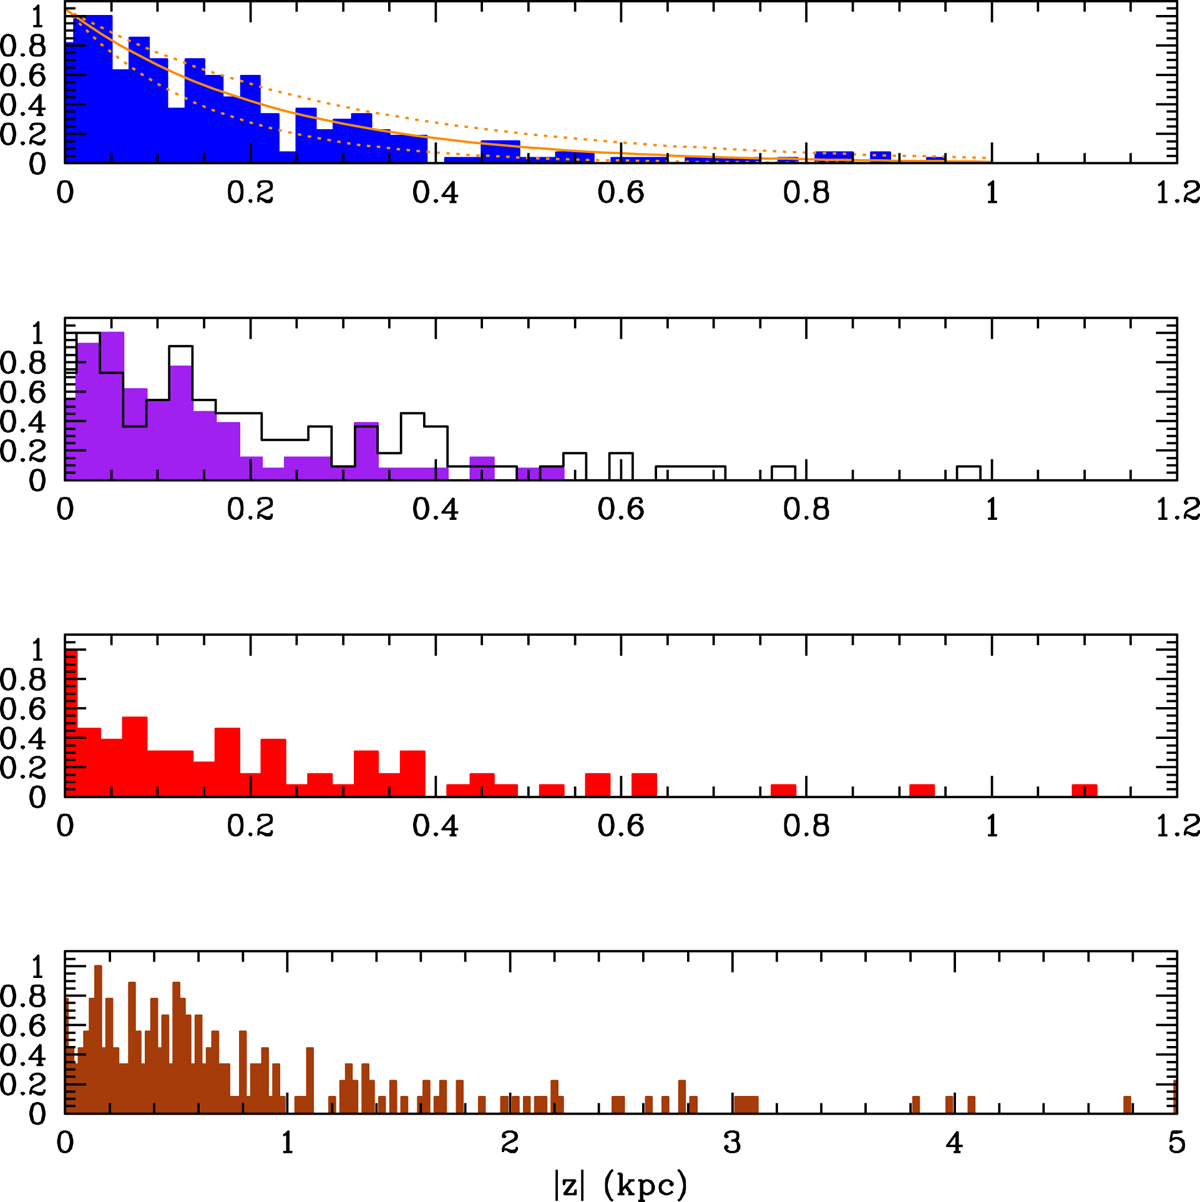
Histograms showing the distribution (normalised to the maximum number of stars) of the |Z|-coordinate for the different spectral types. From top to bottom: normal N-type carbon stars (blue), extrinsic (black) and intrinsic (purple) S stars, J-type stars (red), and R-type stars (brown). The X-axis for the R-type stars is different. For N-type normal carbon stars, orange lines show exponential fits to the distribution with scale heights zo = 260, 220, and 180 pc from top to bottom. Similar fits give an estimate of the scale-height for the other spectral types (see text). The bin size is 20 pc.
Current usage metrics show cumulative count of Article Views (full-text article views including HTML views, PDF and ePub downloads, according to the available data) and Abstracts Views on Vision4Press platform.
Data correspond to usage on the plateform after 2015. The current usage metrics is available 48-96 hours after online publication and is updated daily on week days.
Initial download of the metrics may take a while.