Fig. 12.
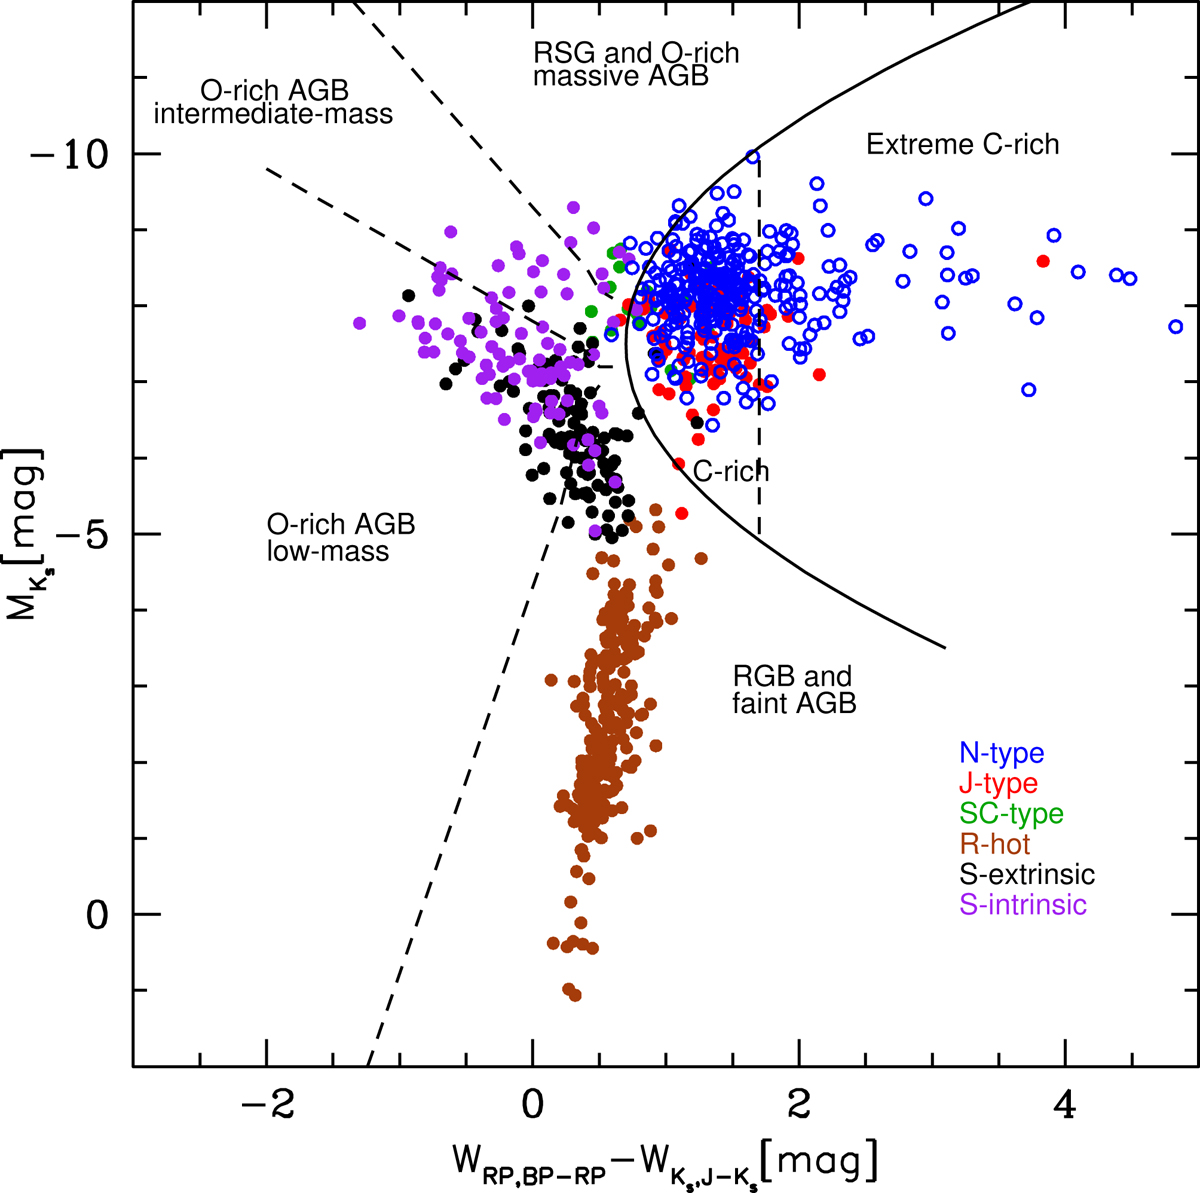
Download original image
Gaia-2MASS diagram for our main star sample. The curved line delineates the theoretical limit between O-rich (left of the line) and C-rich AGB stars (right of the line). Dashed lines separate sub-groups of stars as indicated in the figure. The colour code for the different AGB types is shown in the bottom right corner. Open blue circles show N-type stars for clarity. Several SC-type stars (green circles) and J-type stars (red circles) are placed in the C-rich zone, but cannot be distinguished in the figure because of crowding. The uncertainty in MKs typically is ±0.23 mag.
Current usage metrics show cumulative count of Article Views (full-text article views including HTML views, PDF and ePub downloads, according to the available data) and Abstracts Views on Vision4Press platform.
Data correspond to usage on the plateform after 2015. The current usage metrics is available 48-96 hours after online publication and is updated daily on week days.
Initial download of the metrics may take a while.