Fig. 5.
Download original image
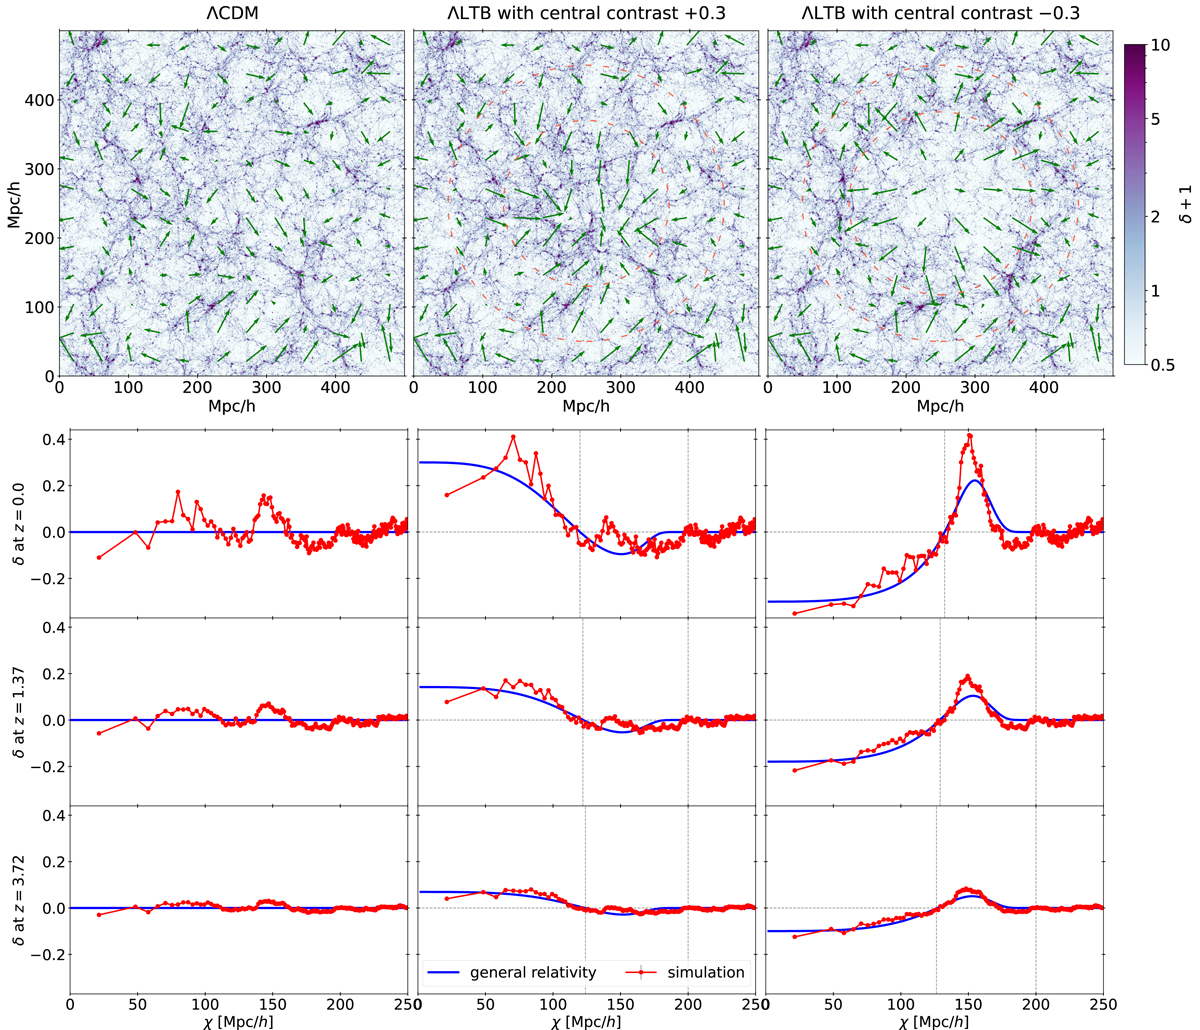
Evolution of the large scale structure in the ΛLTB mode. The first row shows the large-scale structure of Box 1 at z = 0 of the overdense (middle panel) and underdense (right panel) ΛLTB models together with the corresponding ΛCDM model (left panel). The larger thin dashed circle marks the boundary, rb, of the ΛLTB inhomogeneity and the smaller one the radius, rt, at which δ(t0, rt) = 0, which marks the transition from the central underdensity or overdensity to the compensating overdense or underdense shell. The arrows show the velocity field. The density and velocity fields are obtained from the projection of the slice through the center, whose thickness is a fifth of the box side. One can see how the large-scale structure is identical outside the inhomogeneity, but it is distorted by the inhomogeneous bulk flow inside the LTB structure. The last three rows show the evolution of the radial profile, from z = 3.7 to z = 0 (Poissonian errors are negligible). Also shown is the GR solution given by the LTB solution of Sect. 2. The vertical lines mark rb and the smaller rt. While rb is fixed in comoving coordinates, rt moves because of the peculiar velocity of the LTB structure.
Current usage metrics show cumulative count of Article Views (full-text article views including HTML views, PDF and ePub downloads, according to the available data) and Abstracts Views on Vision4Press platform.
Data correspond to usage on the plateform after 2015. The current usage metrics is available 48-96 hours after online publication and is updated daily on week days.
Initial download of the metrics may take a while.