Fig. 7.
Download original image
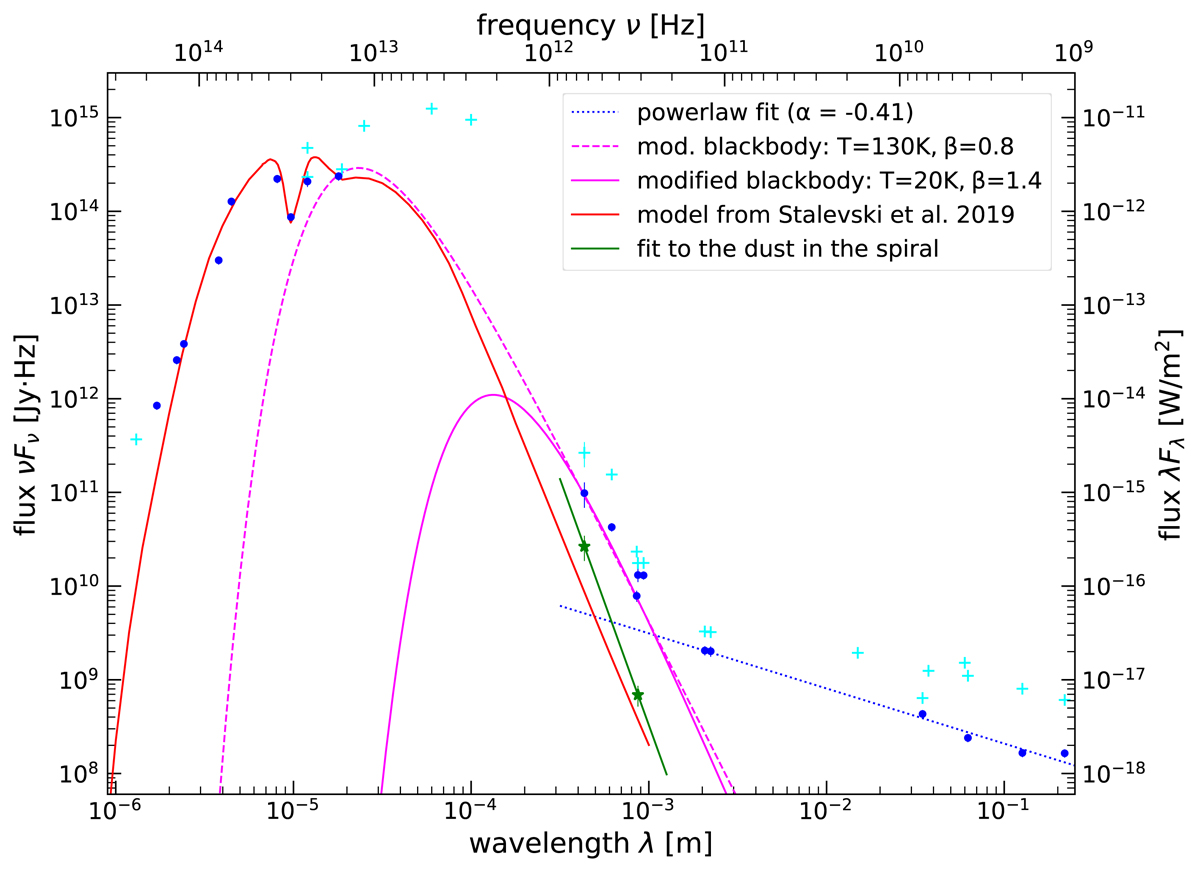
Nuclear spectral energy distribution (SED) of the Circinus galaxy. Blue points are high resolution photometry compiled by Prieto et al. (2010) plus additional measurement with ALMA (see Table 3). Also shown are low resolution measurements (cyan crosses). A power-law fit to the radio continuum data (blue dashed line) yields a slope of α = −0.41 ± 0.04. Modified blackbody emitters for warm dust (T = 130 K and β = α − 2 = 0.8, dashed line) and cold dust (T = 20 K and β = 1.4, continuous line) are shown in magenta. Also plotted is the SED of the model from Stalevski et al. (2019). We also show for comparison flux measurements and a power-law fit (α ∼ 4.2) for the emission in the head of the north-eastern spiral arm (dark green).
Current usage metrics show cumulative count of Article Views (full-text article views including HTML views, PDF and ePub downloads, according to the available data) and Abstracts Views on Vision4Press platform.
Data correspond to usage on the plateform after 2015. The current usage metrics is available 48-96 hours after online publication and is updated daily on week days.
Initial download of the metrics may take a while.