Fig. 3.
Download original image
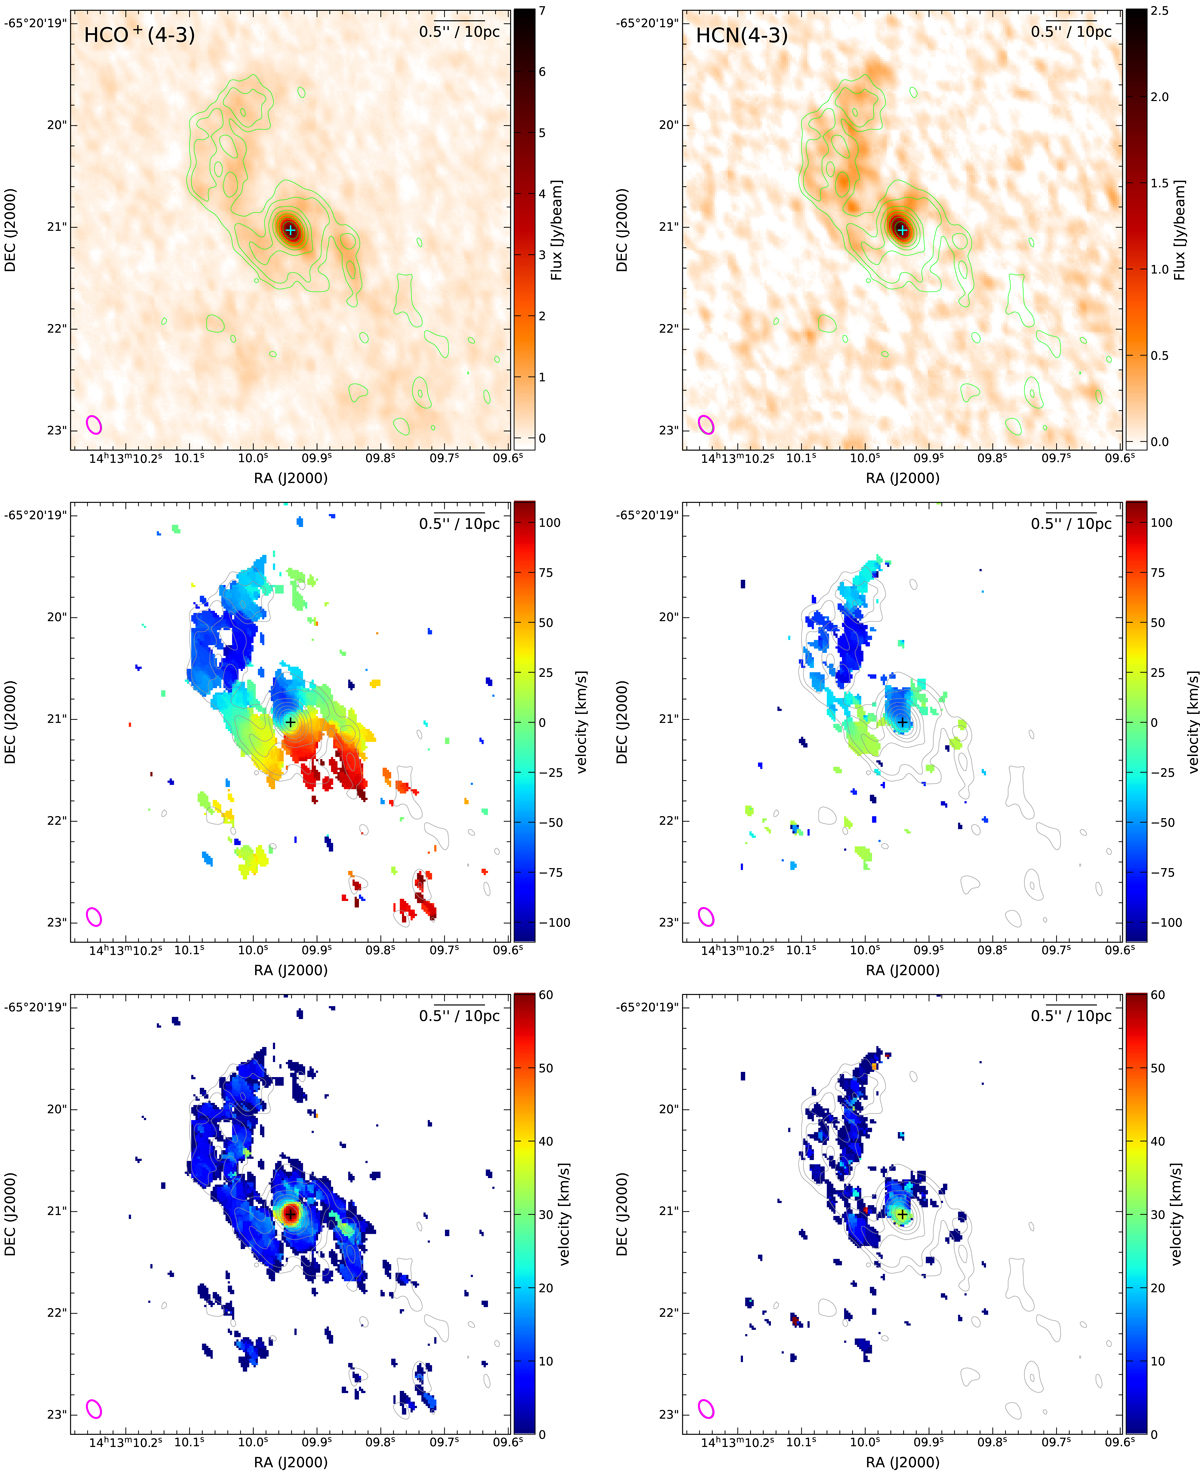
HCO+(4−3) (νrest = 357 GHz, left panels) and HCN(4−3) (νrest = 355 GHz, right panels) moment maps. Top row: the total integrated line emission (moment 0) maps are shown; in the middle row, the velocity (moment 1) maps are displayed; the bottom row shows the velocity dispersion (moment 2). The green/grey contours in all panels are for the 345 GHz continuum as in Fig. 1. For HCN(4−3), only the velocity range from −300 to +15 km s−1 is covered by the observations, so that the south-western, redshifted part of the emission is missing (see Sect. 2).
Current usage metrics show cumulative count of Article Views (full-text article views including HTML views, PDF and ePub downloads, according to the available data) and Abstracts Views on Vision4Press platform.
Data correspond to usage on the plateform after 2015. The current usage metrics is available 48-96 hours after online publication and is updated daily on week days.
Initial download of the metrics may take a while.