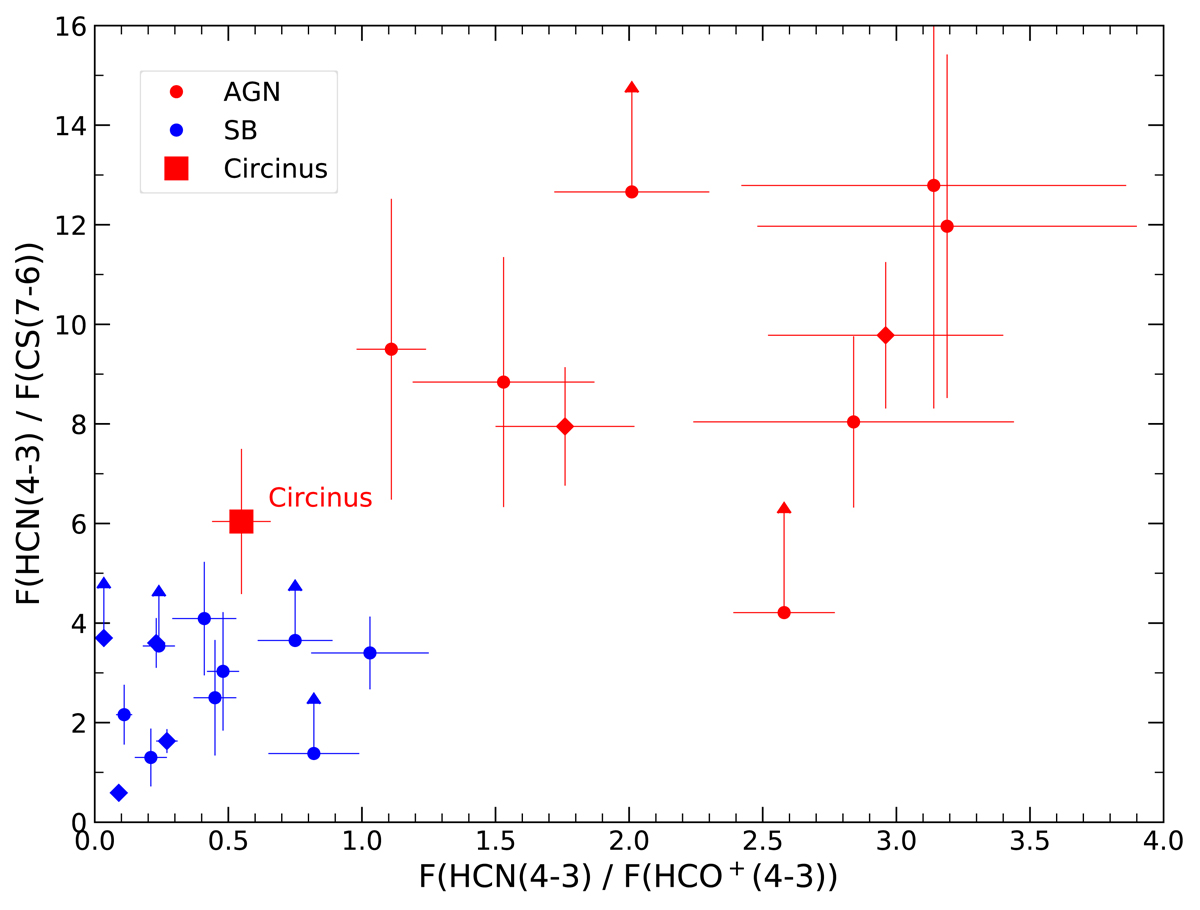
Fig. 13.
Download original image
High resolution (spacial resolution < 500 pc) submillimetre HCN diagram with the HCN(4−3) to CS(4−3) ratio plotted as a function of HCN(4−3)/HCO+(4−3) following Izumi et al. (2016), filled circles. Additional data points for NGC 613 (Audibert et al. 2019) and NGC 1808 (Audibert et al. 2021) are shown by diamonds. The location of the Circinus nucleus derived from our measurements is shown by the large red box.
Current usage metrics show cumulative count of Article Views (full-text article views including HTML views, PDF and ePub downloads, according to the available data) and Abstracts Views on Vision4Press platform.
Data correspond to usage on the plateform after 2015. The current usage metrics is available 48-96 hours after online publication and is updated daily on week days.
Initial download of the metrics may take a while.