Fig. 12.
Download original image
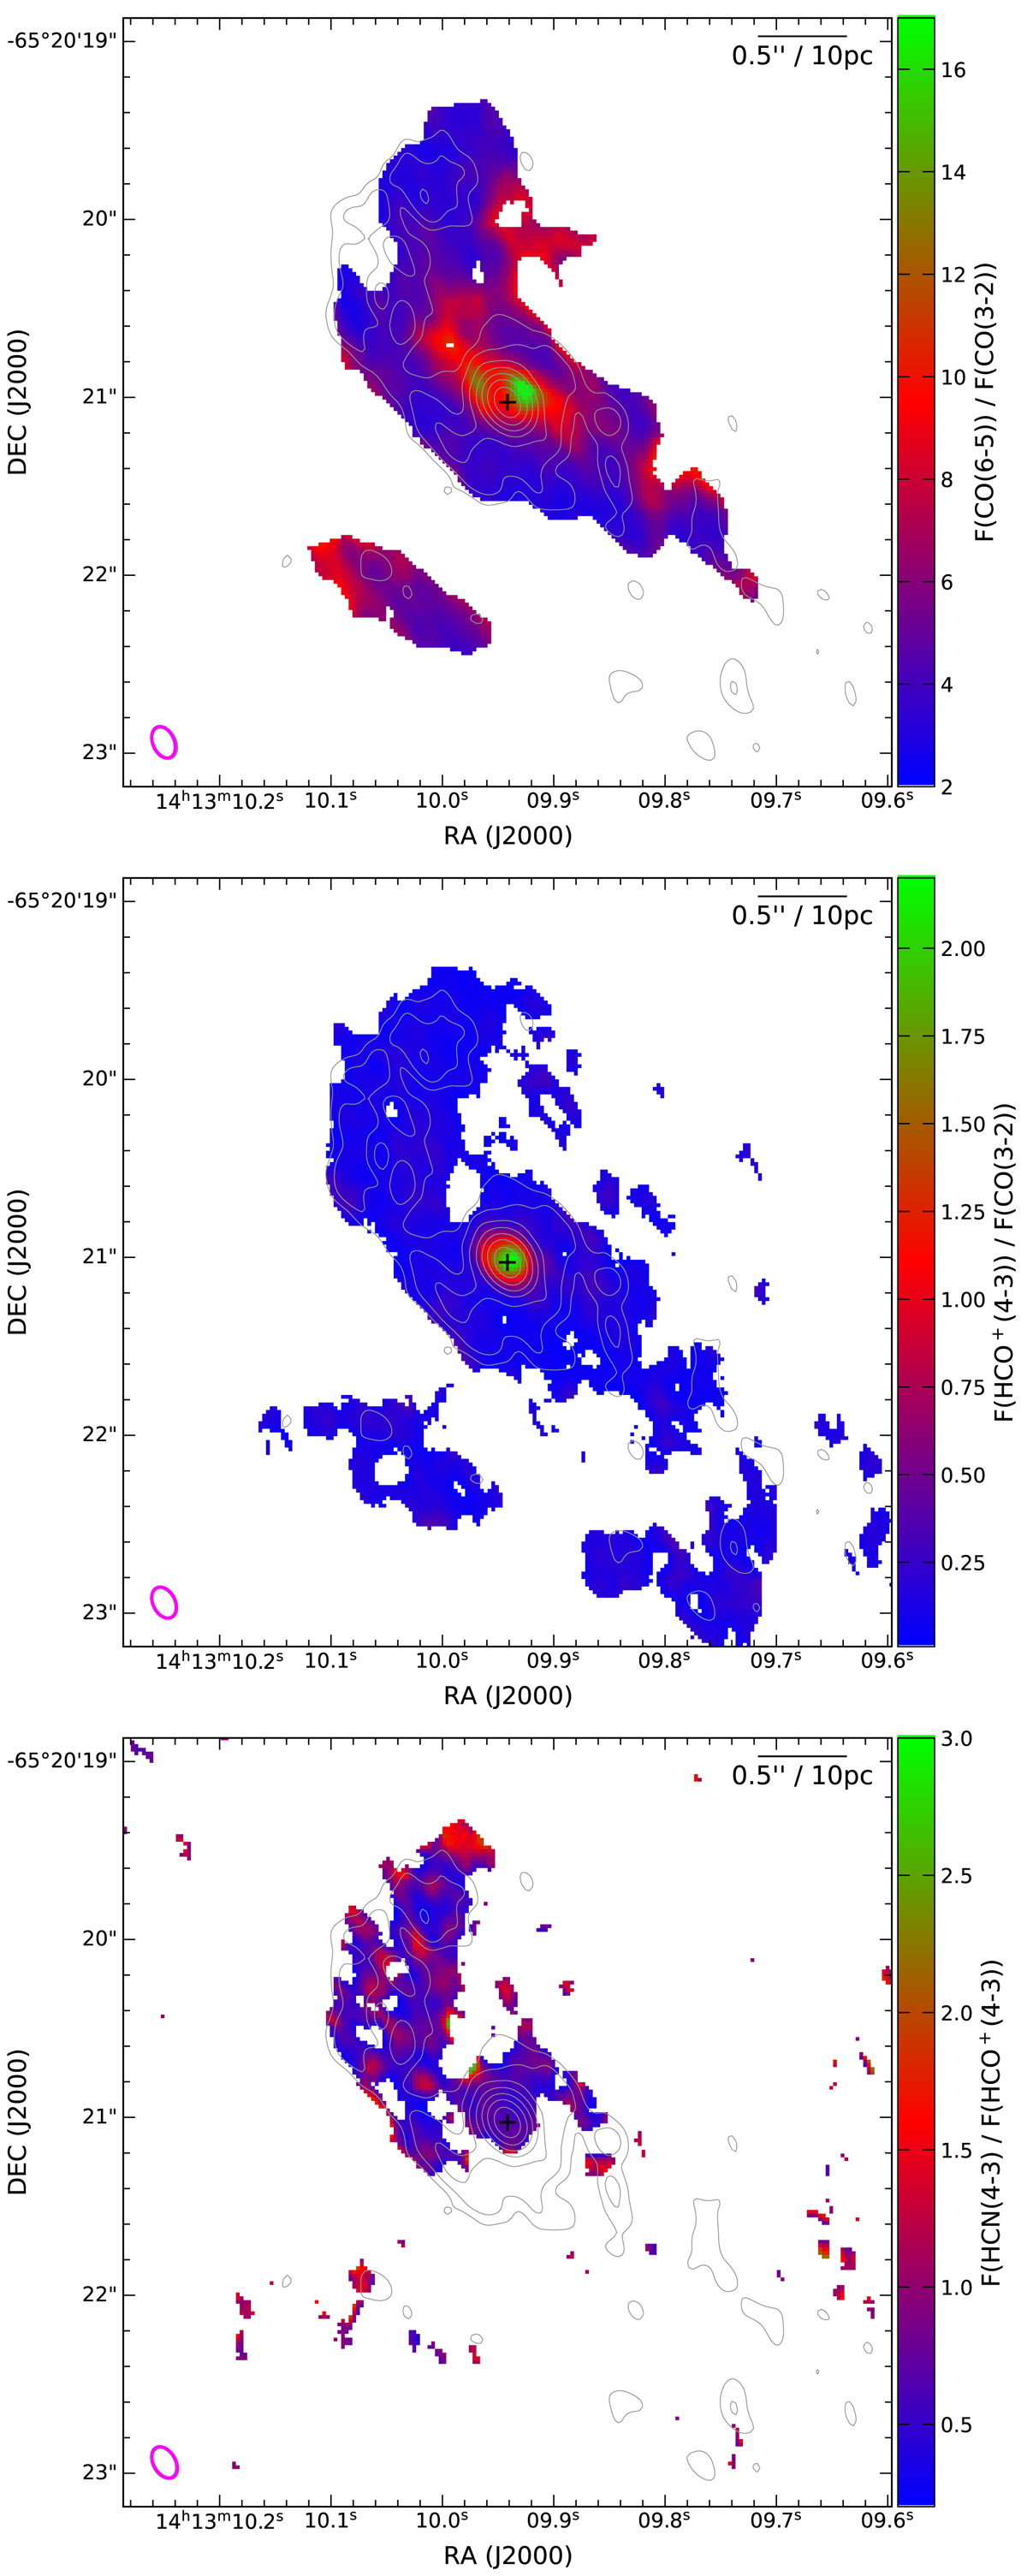
Emission line ratio maps for CO(6−5)/CO(3−2) (top panel), HCO+(4−3)/CO(3−2) (middle panel) and HCN(4−3)/HCO+(4−3) (bottom panel). For the CO(6−5)/CO(3−2) map, the CO(6−5) data were smoothed to the resolution of the CO(3−2) data, while for the HCN(4−3)/HCO+(4−3) map, the HCO+(4−3) was truncated to velocities < 15 km s−1 in order to match the velocity coverage of the HCN(4−3) line.
Current usage metrics show cumulative count of Article Views (full-text article views including HTML views, PDF and ePub downloads, according to the available data) and Abstracts Views on Vision4Press platform.
Data correspond to usage on the plateform after 2015. The current usage metrics is available 48-96 hours after online publication and is updated daily on week days.
Initial download of the metrics may take a while.