Fig. 11.
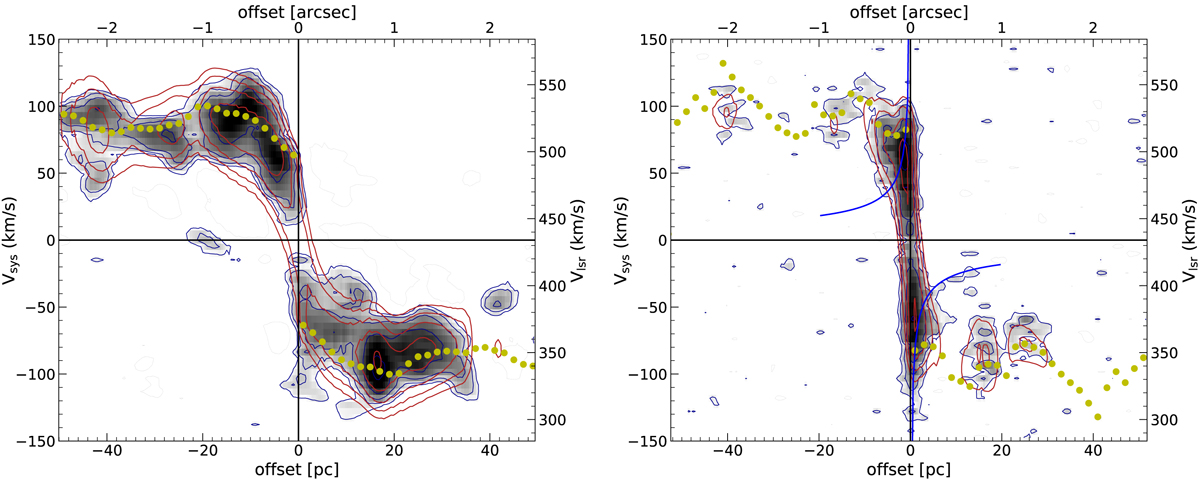
Download original image
Position velocity diagrams along the major axis (ϕ ∼ 220°) for CO(3−2) (left) and HCO+(4−3) (right). The data are shown in grey-scale and blue contours; the model with 3DBAROLO is overplotted in red contours, the values of the modelled line-of-sight velocities vlos = sini × vrot are plotted as yellow filled circles. For HCO+(4−3), the expected Keplerian rotation curve for a (1.7 ± 0.3) × 106 M⊙ black hole (Greenhill et al. 2003) is indicated in blue.
Current usage metrics show cumulative count of Article Views (full-text article views including HTML views, PDF and ePub downloads, according to the available data) and Abstracts Views on Vision4Press platform.
Data correspond to usage on the plateform after 2015. The current usage metrics is available 48-96 hours after online publication and is updated daily on week days.
Initial download of the metrics may take a while.