Fig. 5
Download original image
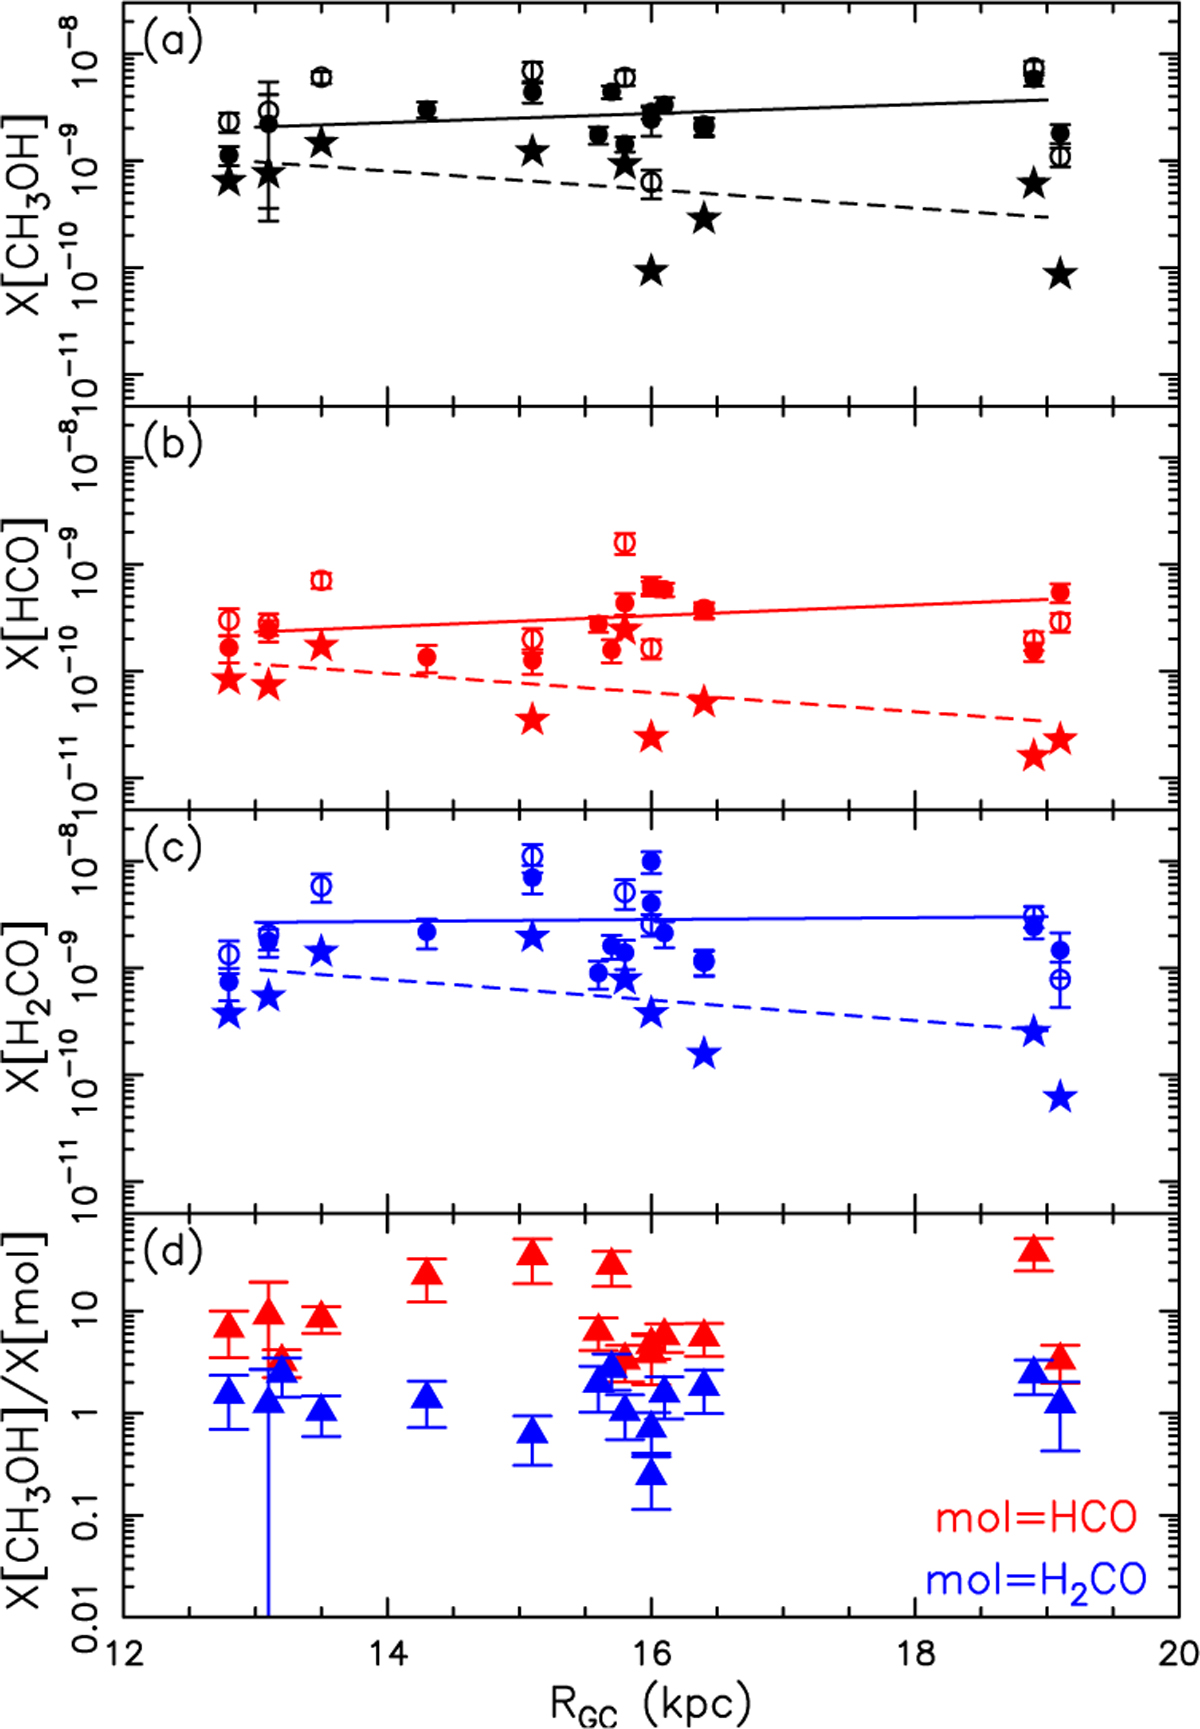
Fractional abundances as a function of RGC. Panels a, b, and c: fractional abundances of, from top to bottom, CH3OH, HCO, and H2CO, as a function of RGC. The fractional abundances are derived from NCO(H2) given in Blair et al. (2008) (filled circles, Table 1) and from NHer(H2) given in Elia et al. (2021) (empty circles, Table 6). The stars correspond to the values computed from NHer(H2) corrected for the Galactocentric trend for the gas-to-dust ratio given in Giannetti et al. (2017). In all panels, the solid and dashed lines connect the values obtained at 13 and 19 kpc from a linear regression fit applied to the points computed from NHer(H2) without and with corrections, respectively, for the Galactocentric trend of the gas-to-dust ratio. Panel d: Abundance ratios X[CH3OH]/X[HCO] (red triangles) and X[CH3OH]/X[H2CO] (blue triangles) as a function of RGC.
Current usage metrics show cumulative count of Article Views (full-text article views including HTML views, PDF and ePub downloads, according to the available data) and Abstracts Views on Vision4Press platform.
Data correspond to usage on the plateform after 2015. The current usage metrics is available 48-96 hours after online publication and is updated daily on week days.
Initial download of the metrics may take a while.