Fig. 9
Download original image
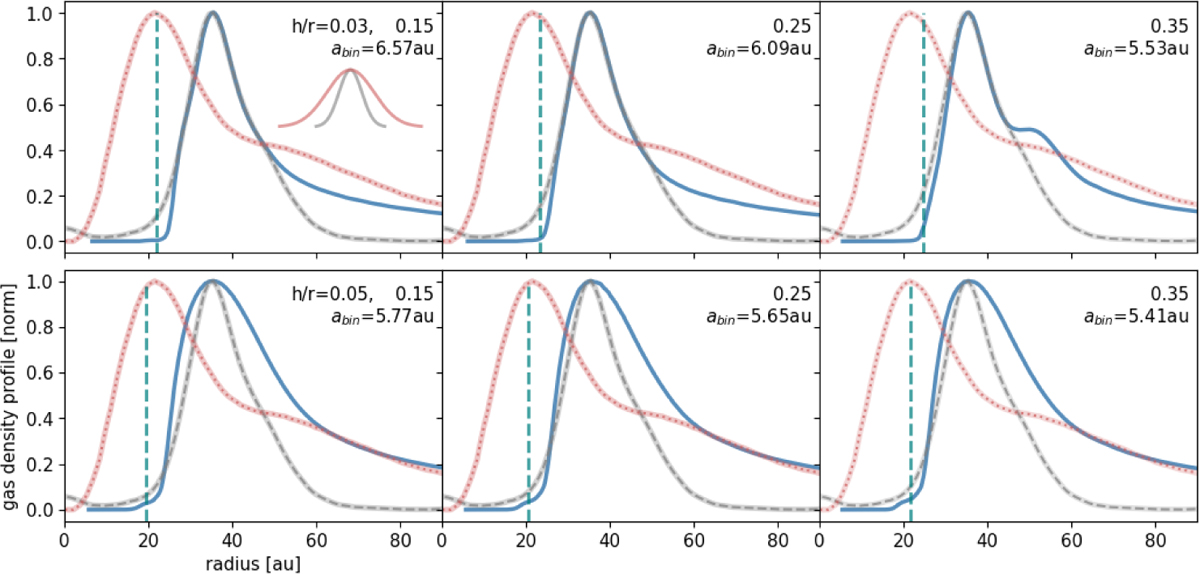
Comparison of azimuthally averaged radial profiles from the 12CO emission (in dotted red), dust continuum emission (in dashed gray), and gas density profile from each simulation setup (in solid blue), calculated as the median from the last 1000 orbits. The value of abin is calculated for each simulation to match the peak density position with the peak brightness position of the dust continuum. The values for ebin increase from left to right, and each row has a constant disk aspect ratio. The average radial resolution of the 12CO and dust continuum are shown in the upper left panel, with Gaussians of the same colors. A dashed vertical line marks the position of the simulated planet.
Current usage metrics show cumulative count of Article Views (full-text article views including HTML views, PDF and ePub downloads, according to the available data) and Abstracts Views on Vision4Press platform.
Data correspond to usage on the plateform after 2015. The current usage metrics is available 48-96 hours after online publication and is updated daily on week days.
Initial download of the metrics may take a while.