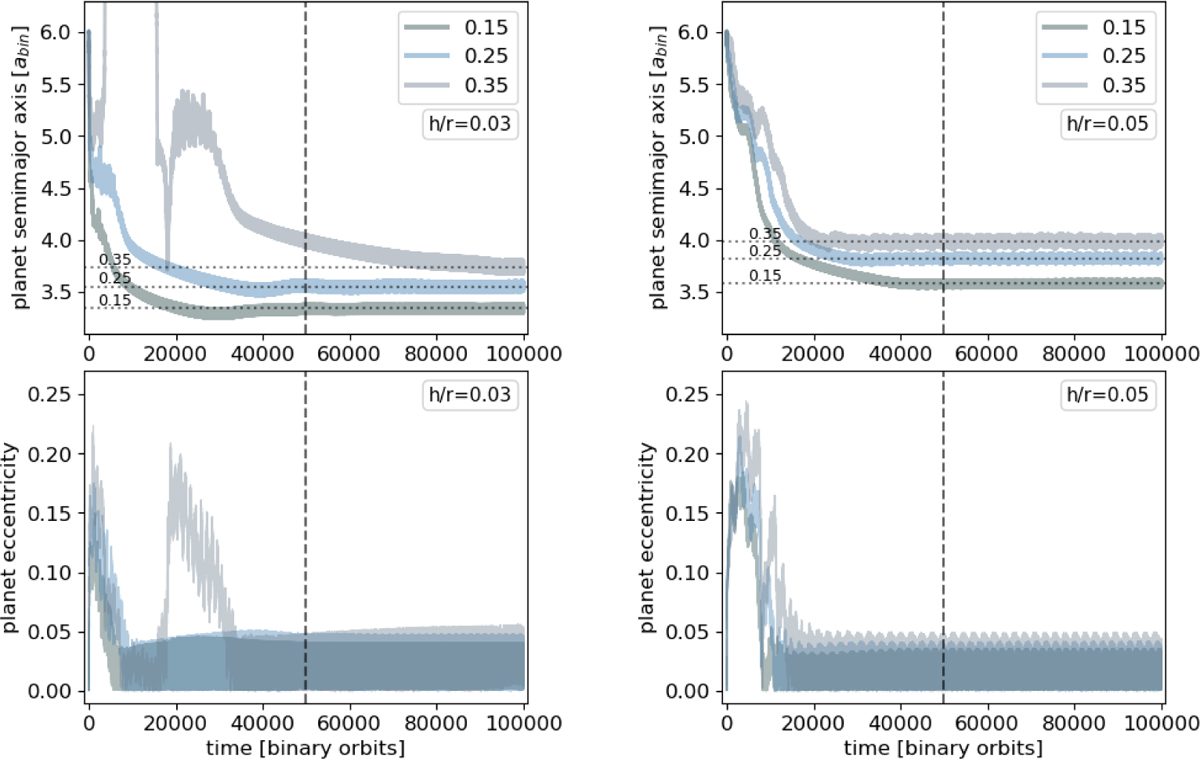
Fig. 8
Download original image
Planet’s semi-major axis and eccentricity as a function of time (in binary orbits) in the upper and lower panel row, respectively. The upper right number in each plot indicates the eccentricity of the binaries. The dashed vertical curve indicates the position of the 50 000 binary orbits, after which the planet has converged to its equilibrium orbit. The median semi-major axis for the planet orbit after convergence is indicated with a dotted line.
Current usage metrics show cumulative count of Article Views (full-text article views including HTML views, PDF and ePub downloads, according to the available data) and Abstracts Views on Vision4Press platform.
Data correspond to usage on the plateform after 2015. The current usage metrics is available 48-96 hours after online publication and is updated daily on week days.
Initial download of the metrics may take a while.