Fig. 5
Download original image
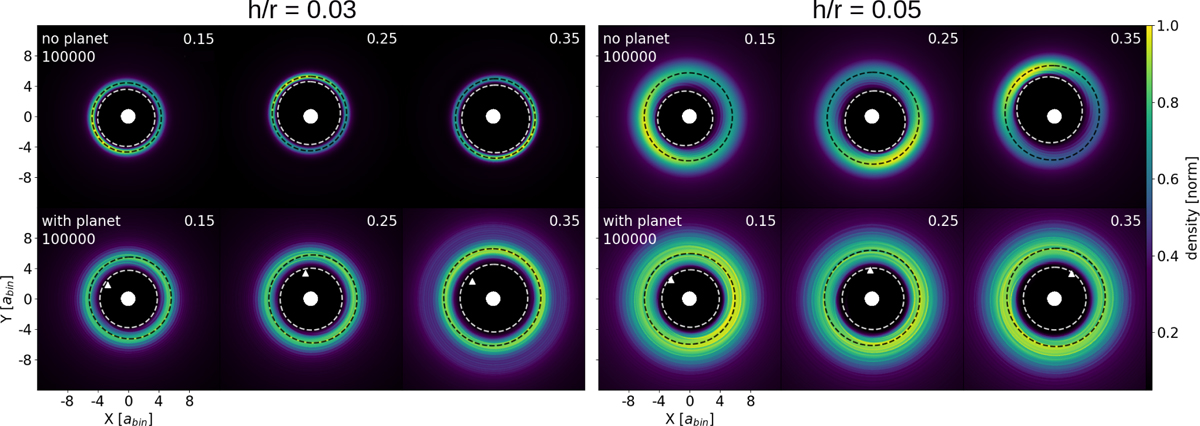
Gas surface density after 100 000 binary orbits in each setup. Distance is in binary separations and the color scale is normalized to the maximum of each image. Panels on the left and right show the setups with h/r = 0.03 and h/r = 0.05 respectively. In each panel, the columns show the setups with the same binary eccentricity, being 0.15, 0.25, and 0.35 from left to right. The upper row of each panel contains the setups with no planet, and the lower row the setups with planet. A white dashed line shows the best cavity fit, while the black dashed line shows the best peak ring fit. A white triangle is used to show the position of the planet.
Current usage metrics show cumulative count of Article Views (full-text article views including HTML views, PDF and ePub downloads, according to the available data) and Abstracts Views on Vision4Press platform.
Data correspond to usage on the plateform after 2015. The current usage metrics is available 48-96 hours after online publication and is updated daily on week days.
Initial download of the metrics may take a while.