Fig. 4
Download original image
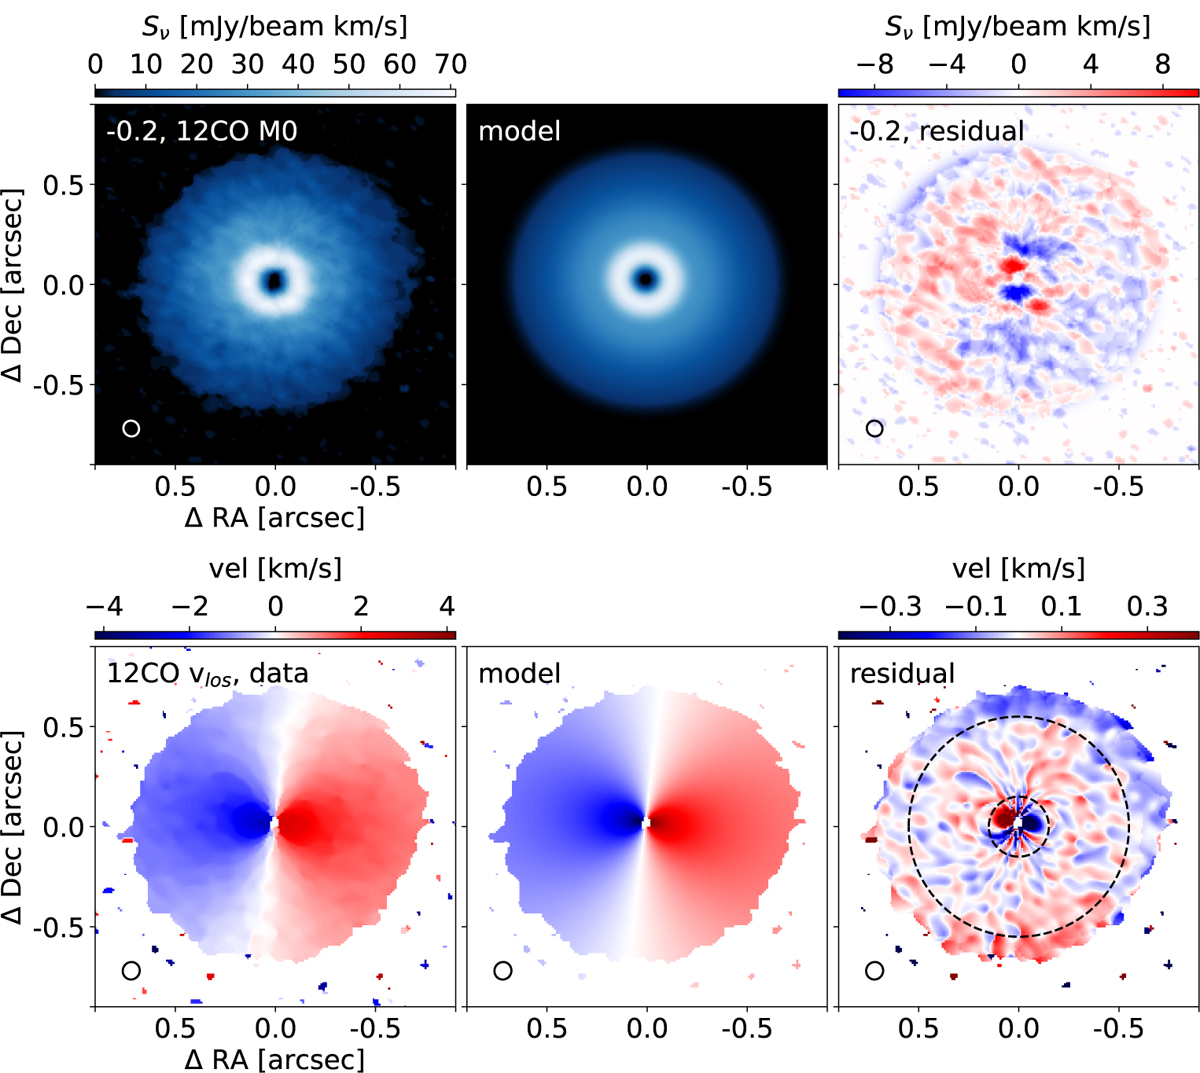
CS Cha gas emission and kinematics. Upper row: 12CO moment 0, the best model using the geometry recovered from the kinematic fit, and the residuals. Scale bar represents 20 au at the distance of the source. Lower row: 12CO peak velocity in the line of sight, with the best model calculated with the parameters from Table 2, and the residuals. The dashed line shows the mask used for the fit.
Current usage metrics show cumulative count of Article Views (full-text article views including HTML views, PDF and ePub downloads, according to the available data) and Abstracts Views on Vision4Press platform.
Data correspond to usage on the plateform after 2015. The current usage metrics is available 48-96 hours after online publication and is updated daily on week days.
Initial download of the metrics may take a while.