Fig. A.4
Download original image
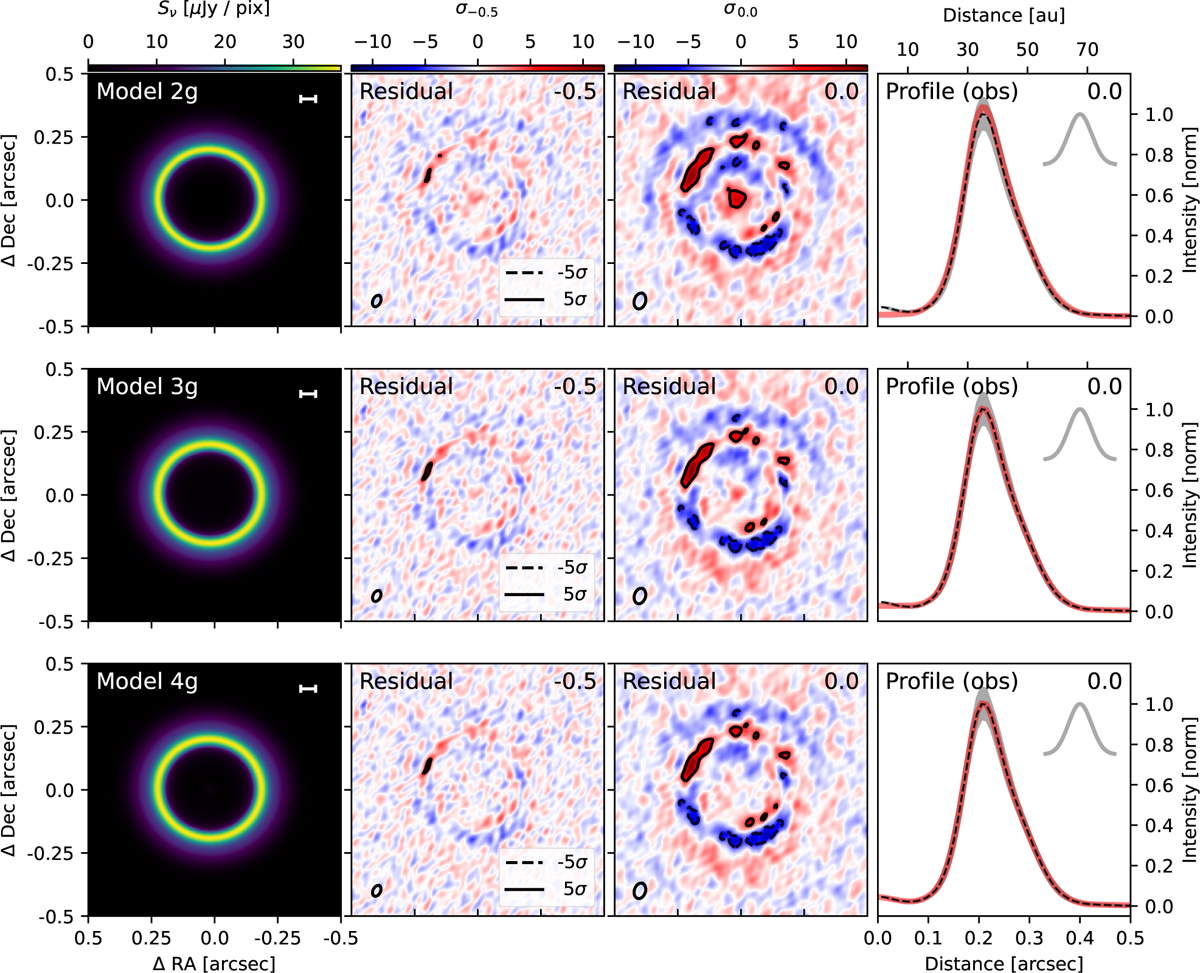
Best solutions for the dust continuum emission generated with the Models 2g, 3g and 4g. Left panel shows the best model, and middle panels shows the residuals left by the best model after being imaged with different robust parameters, shown in the upper right corned. Right panel shows the intensity profile of the model obtained from tclean (in dashed black) and the best respective model (in red).
Current usage metrics show cumulative count of Article Views (full-text article views including HTML views, PDF and ePub downloads, according to the available data) and Abstracts Views on Vision4Press platform.
Data correspond to usage on the plateform after 2015. The current usage metrics is available 48-96 hours after online publication and is updated daily on week days.
Initial download of the metrics may take a while.