Fig. A.2
Download original image
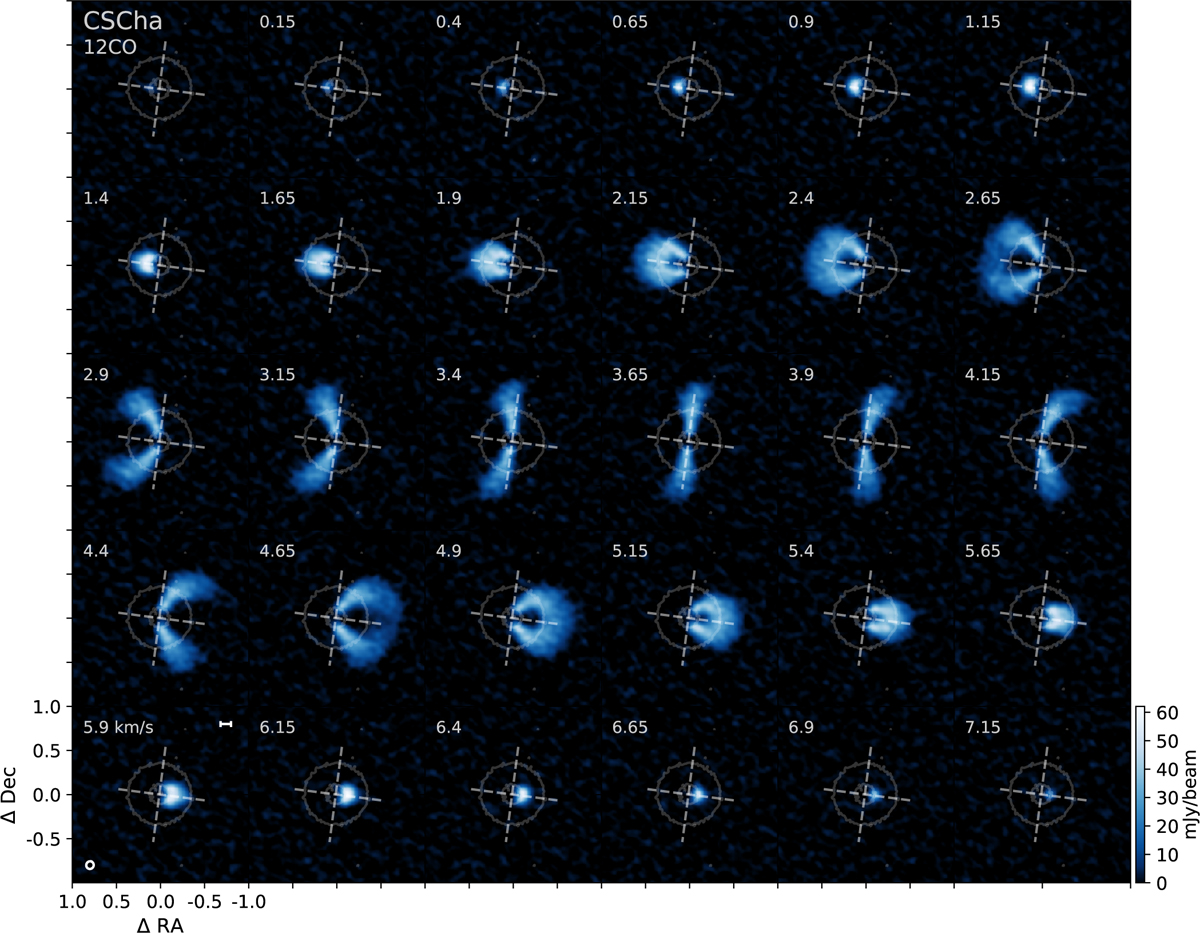
12CO Channel maps of CS Cha, generated with a robust parameter of 0.0. The velocity of each channel is shown in the upper right corner. The contours are the 5σ level of the continuum image generated with a robust parameter of 0.0. Lower left panel: Scale bar represents 20 au at the distance of the source, and ellipse represents the beam size for all the images.
Current usage metrics show cumulative count of Article Views (full-text article views including HTML views, PDF and ePub downloads, according to the available data) and Abstracts Views on Vision4Press platform.
Data correspond to usage on the plateform after 2015. The current usage metrics is available 48-96 hours after online publication and is updated daily on week days.
Initial download of the metrics may take a while.