Fig. 1
Download original image
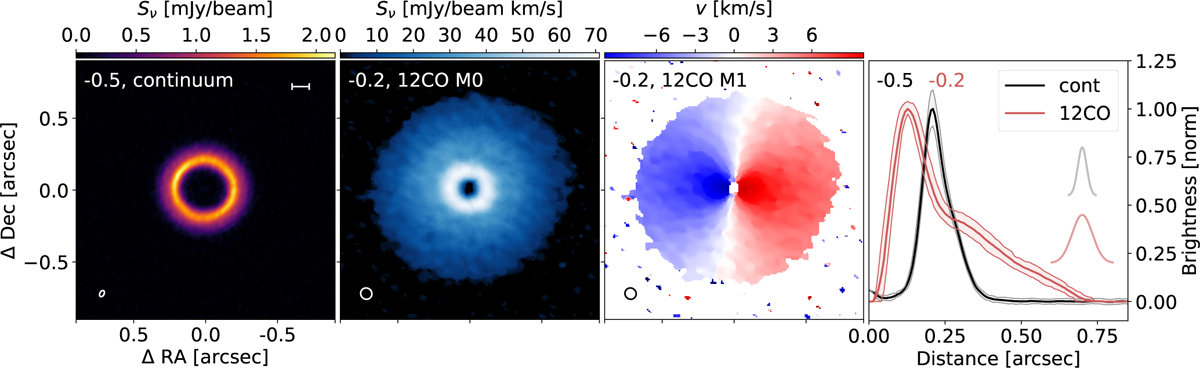
Reconstructed images of dust continuum emission and 12CO. From left to right: dust continuum emission from CS Cha imaged with a robust parameter of −0.5, moment 0 and moment 1 of the 12CO imaged with a robust of −0.2, and radial profiles for the continuum and 12CO emission calculated by deprojecting the images with the inclination and position angle of Model 2e (see Sect. 3.3). The ellipse in the left bottom corner of the panels represents the synthesized beam of the images, which is 30 * 46 mas for the dust continuum and 80 * 77 mas for the 12CO. The scale bar in the top right of the first panel represents 20 au at the distance of the source. The Gaussians in the right panel represent the average radial resolution of the profiles, and in the same panel, the colored region in the profiles represent the 1 σ dispersion at each radial location.
Current usage metrics show cumulative count of Article Views (full-text article views including HTML views, PDF and ePub downloads, according to the available data) and Abstracts Views on Vision4Press platform.
Data correspond to usage on the plateform after 2015. The current usage metrics is available 48-96 hours after online publication and is updated daily on week days.
Initial download of the metrics may take a while.