Fig. 3
Download original image
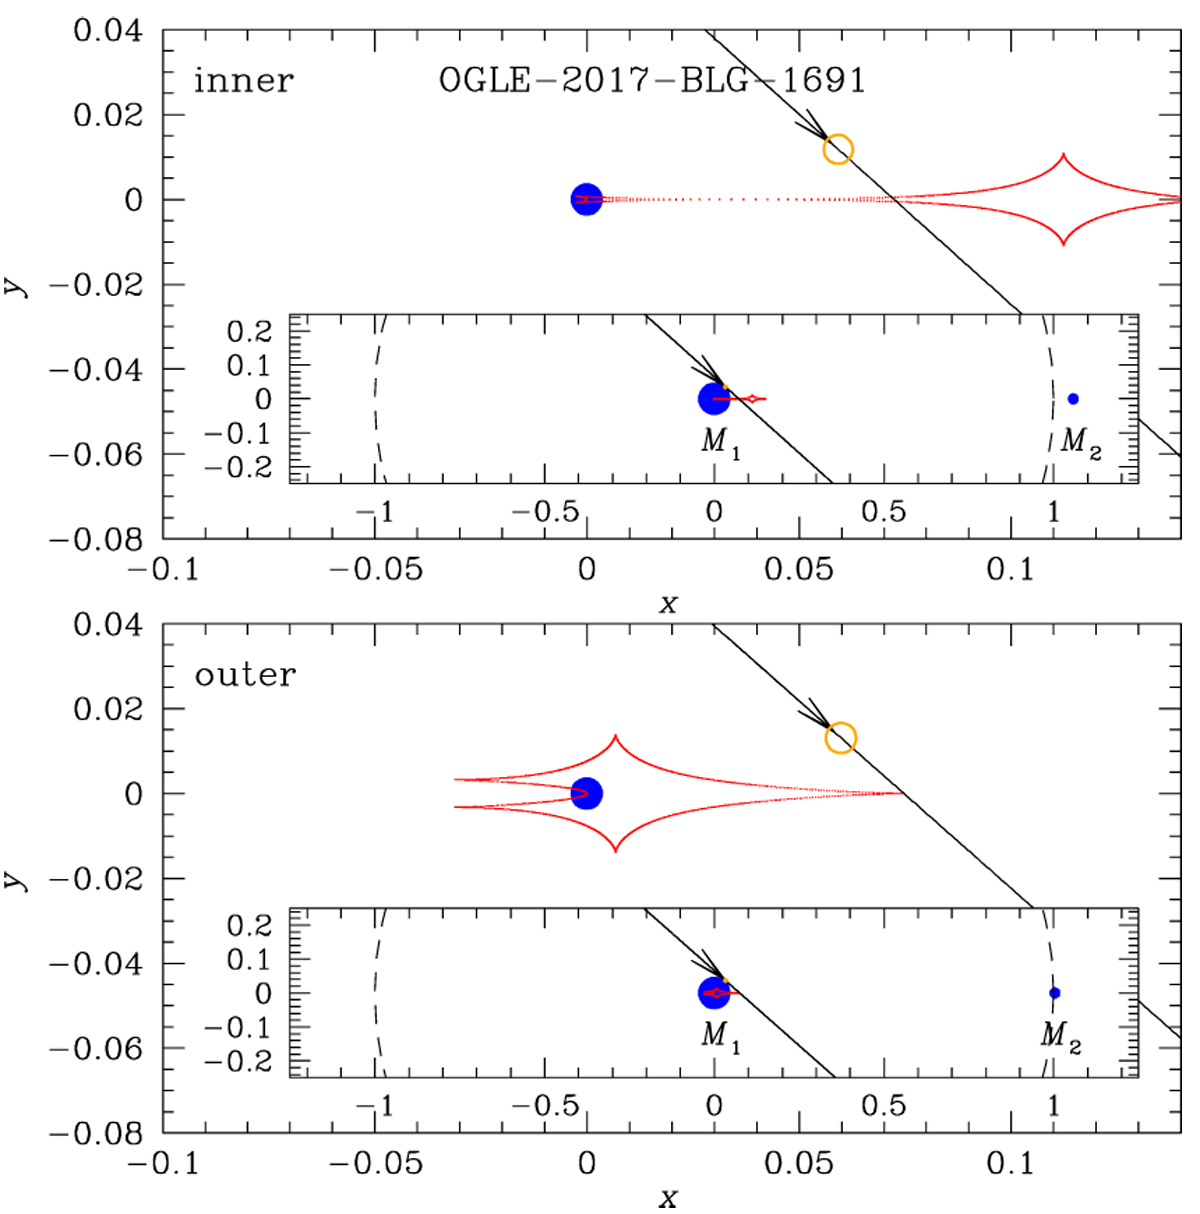
Lens system configurations of OGLE-2017-BLG-1691: upper panel (inner solution) and lower panel (outer solution). The inset in each panel shows the whole view of the lens system, and the main panel presents the zoom-in view of the caustics. The red cuspy figure is the caustic and the line with an arrow is the source trajectory. The orange circle on the trajectory is drawn to represent the source scale with respect to the caustic. The blue solid dots marked by M1 and M2 indicate the positions of the host and planet, respectively. The dashed circle with unit radius in the inset represents the Einstein ring.
Current usage metrics show cumulative count of Article Views (full-text article views including HTML views, PDF and ePub downloads, according to the available data) and Abstracts Views on Vision4Press platform.
Data correspond to usage on the plateform after 2015. The current usage metrics is available 48-96 hours after online publication and is updated daily on week days.
Initial download of the metrics may take a while.