Fig. 2
Download original image
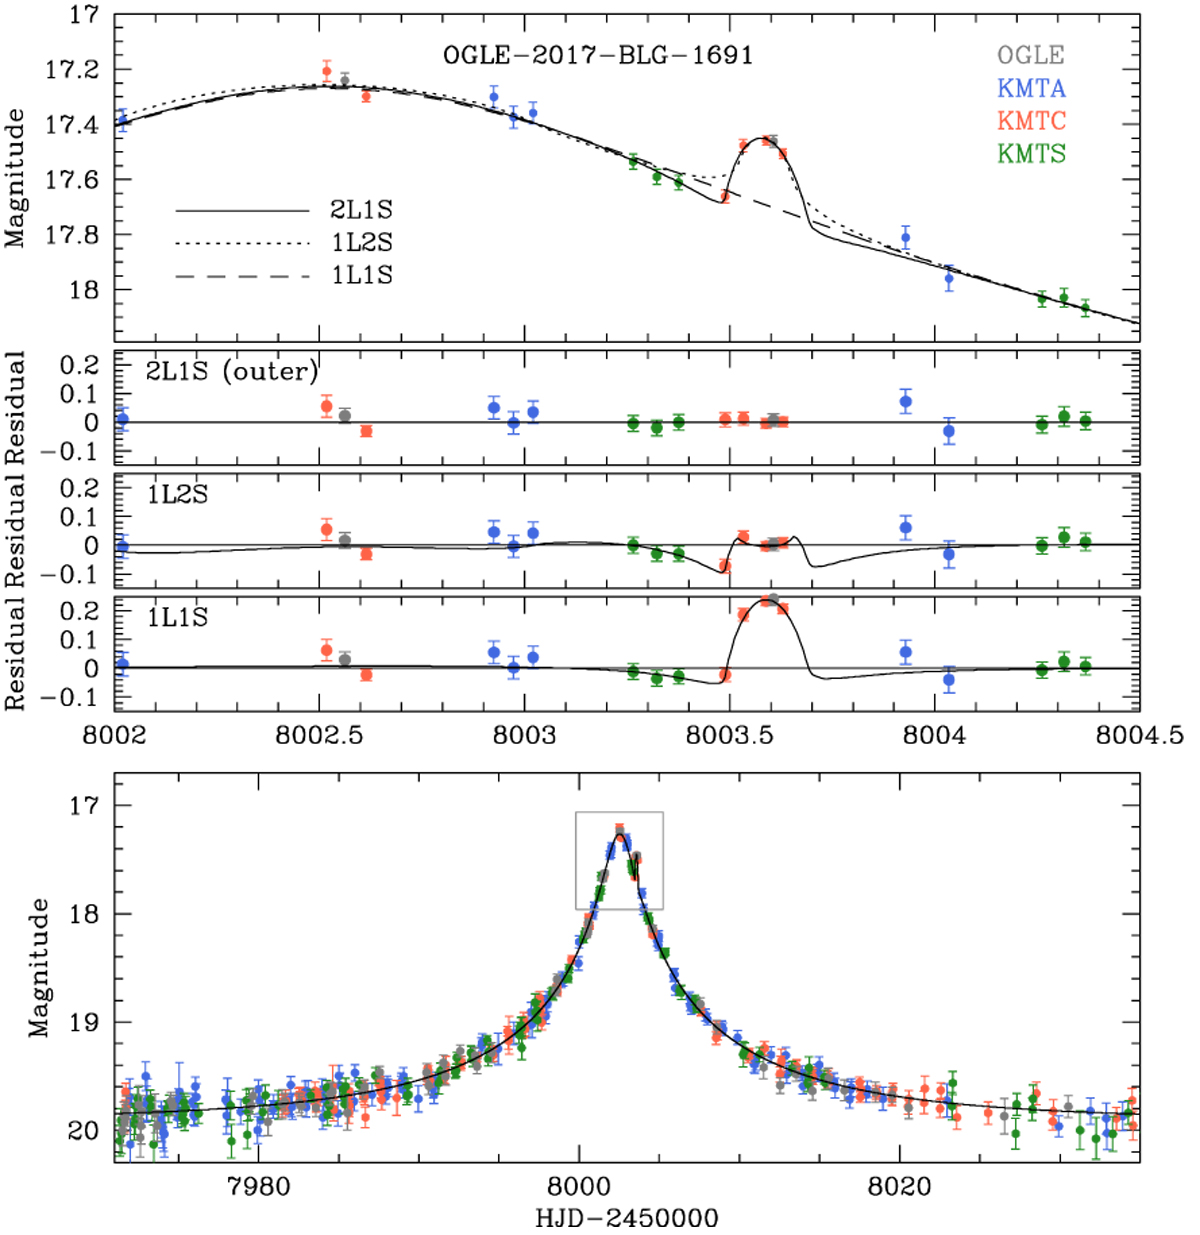
Lensing light curve of OGLE-2017-BLG-1691. Bottom panel: whole view, and the top panel displays the enlargement of the region around the anomaly (the region enclosed by a box in the bottom panel). In the top panel, curves of the three tested models, 2L1S (outer), 1L2S, and 1L1S models, are drawn over the data points, and the residuals from the individual models are presented in the three middle panels. The curve drawn in the bottom panel is the best-fit model (outer 2L1S model). Colors of data points are set to match those of the telescopes used for observations marked in the legend. The curves drawn in the 1L2S and 1L1S residual panels represent the differences from the 2L1S model.
Current usage metrics show cumulative count of Article Views (full-text article views including HTML views, PDF and ePub downloads, according to the available data) and Abstracts Views on Vision4Press platform.
Data correspond to usage on the plateform after 2015. The current usage metrics is available 48-96 hours after online publication and is updated daily on week days.
Initial download of the metrics may take a while.