Fig. 10
Download original image
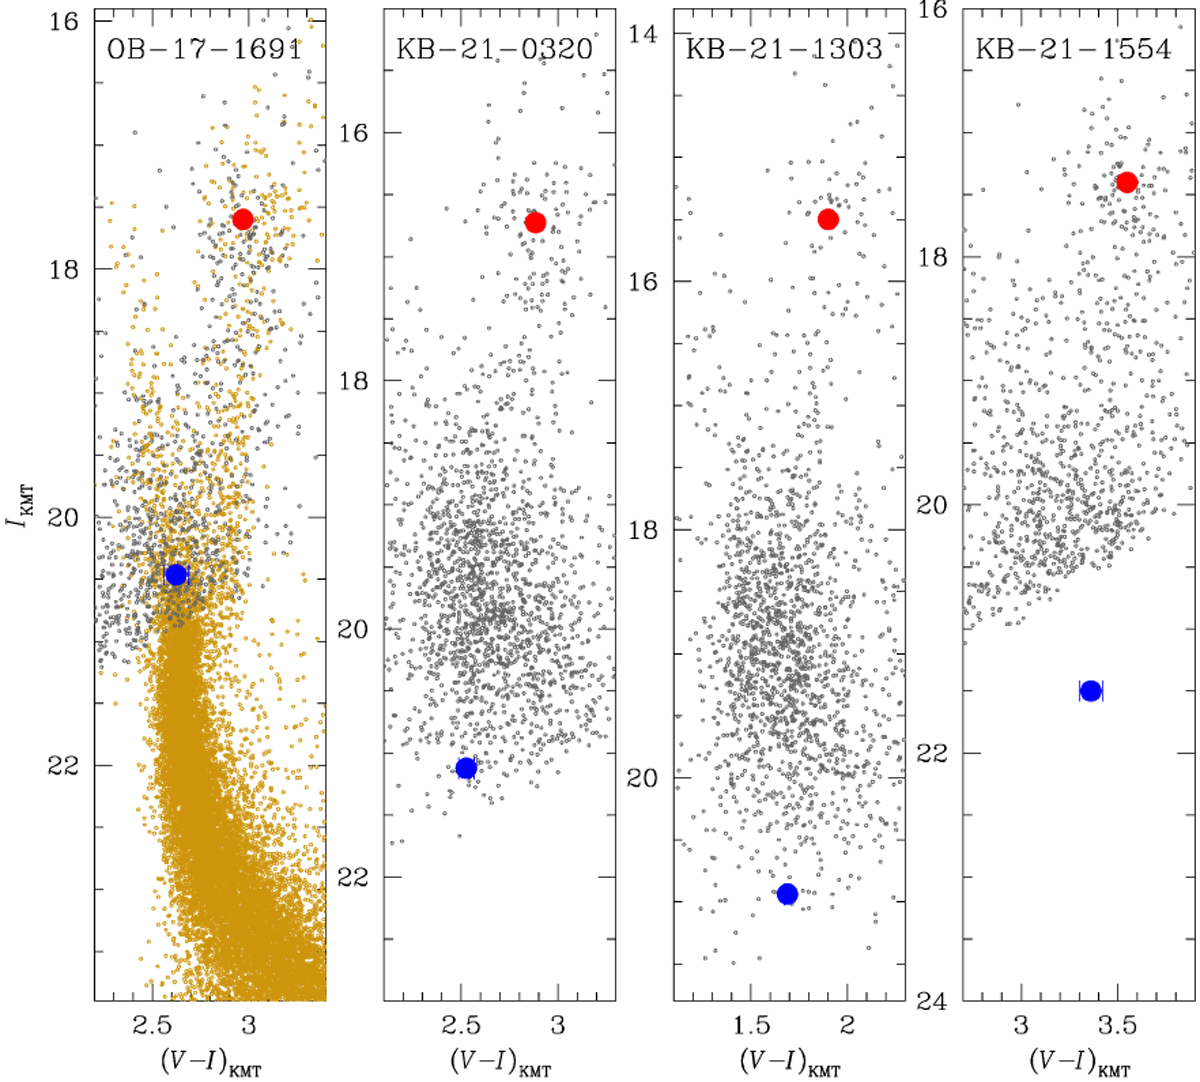
Source locations with respect to the centroids of the red giant clump (RGC) on the instrumental color-magnitude diagrams of stars lying around the source stars of the events OGLE-2017-BLG-1691, KMT-2021-BLG-0320, KMT-2021-BLG-1303, and KMT-2021-BLG-1554. For OGLE-2017-BLG-1691, the CMD is constructed by combining the two CMDs from KMTC (grey dots) and HST (brown dots) observations. For each event, the locations of the source and RGC centroid are marked by blue and red solid dots, respectively.
Current usage metrics show cumulative count of Article Views (full-text article views including HTML views, PDF and ePub downloads, according to the available data) and Abstracts Views on Vision4Press platform.
Data correspond to usage on the plateform after 2015. The current usage metrics is available 48-96 hours after online publication and is updated daily on week days.
Initial download of the metrics may take a while.