Fig. 4.
Download original image
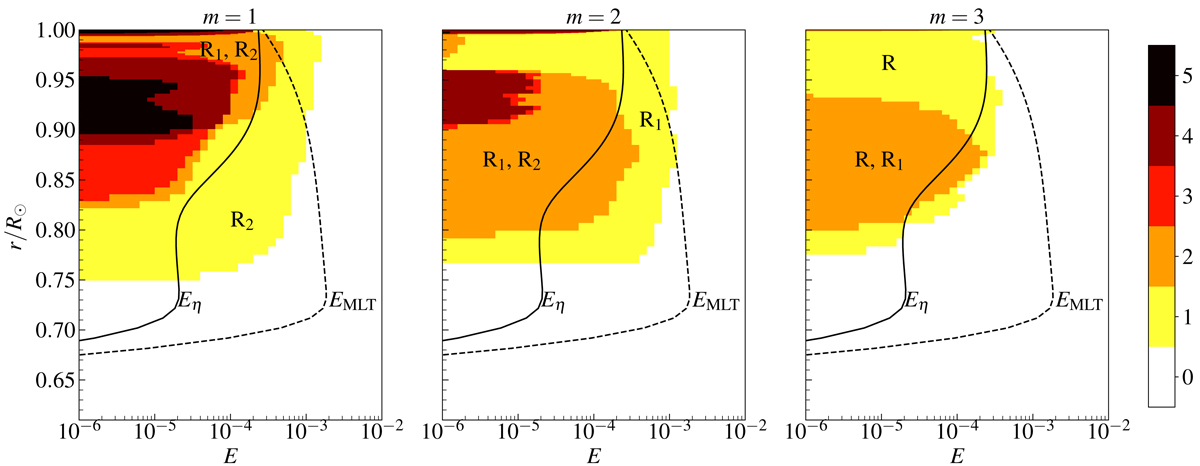
Number of unstable modes as a function of the Ekman number at different radii for m = 1, 2, 3. For m ≥ 4, all modes are stable. The solar differential rotation is from Larson & Schou (2018). The dashed-black line gives the Ekman number EMLT as a function of the radius using the turbulent viscosity from mixing-length theory (Muñoz-Jaramillo et al. 2011). The solid black line shows the Ekman number Eη, using the quenched diffusivity model proposed by Muñoz-Jaramillo et al. (2011), see their Fig. 4b. The regions corresponding to the most unstable modes (R2, R1, and R) and to the two most unstable modes (R2 and R1, R1 and R2, and R and R1) are colored and labeled with these modes. The color bar indicates the total number of unstable modes at any point in the diagram.
Current usage metrics show cumulative count of Article Views (full-text article views including HTML views, PDF and ePub downloads, according to the available data) and Abstracts Views on Vision4Press platform.
Data correspond to usage on the plateform after 2015. The current usage metrics is available 48-96 hours after online publication and is updated daily on week days.
Initial download of the metrics may take a while.