Fig. 2.
Download original image
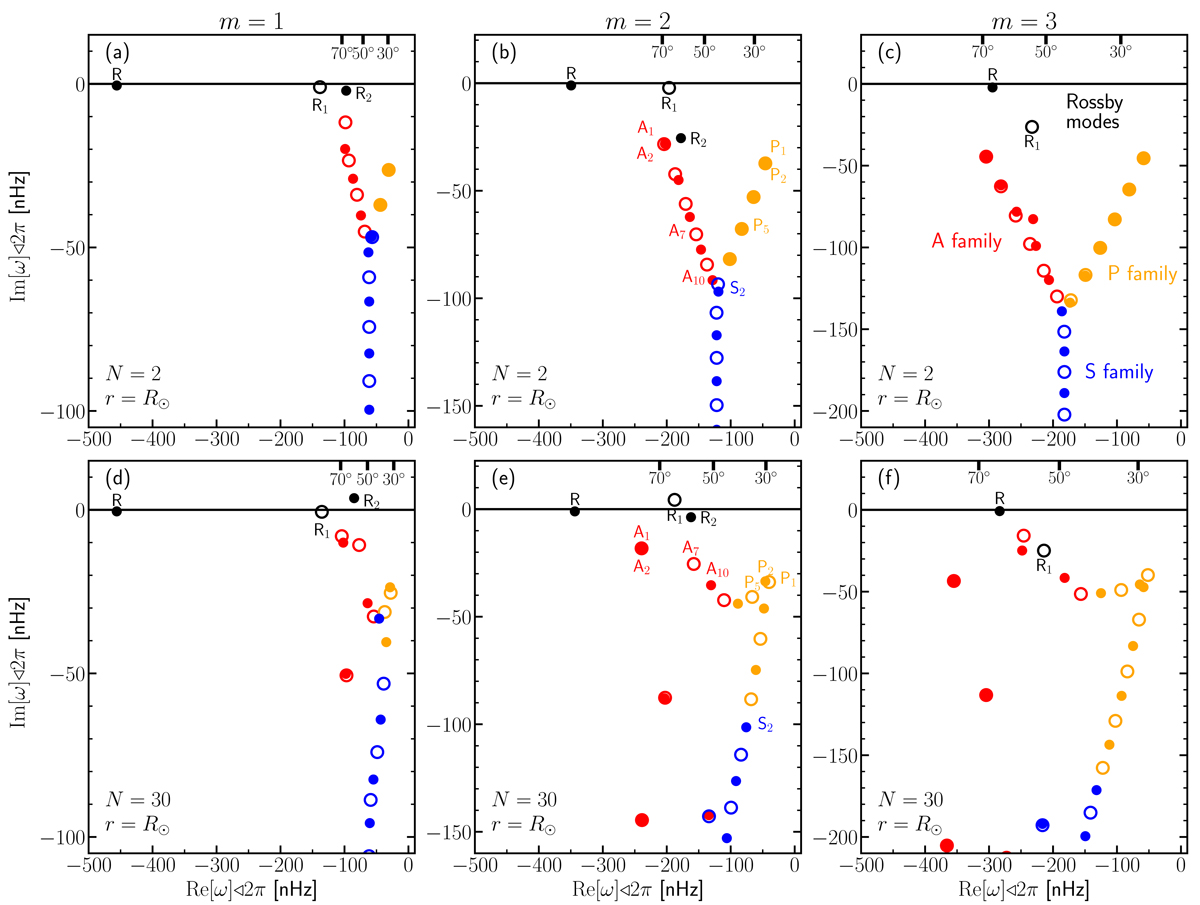
Eigenfrequencies ω for m = 1–3 (from left to right). The Ekman number is E = 4 × 10⁻⁴. The top panels are for Ω(N = 2) = Ω0 + Ω2cos2θ, with Ω0/2π = 452 nHz and Ω2/2π = −114 nHz, and the bottom panels are for the solar rotation rate Ω(N = 30). Modes with north-south symmetric eigenfunctions are shown with filled symbols, and those with antisymmetric eigenfunctions are shown with open symbols. The frequencies are expressed in the Carrington frame of reference. We note that the imaginary part of the frequency is connected to the mode linewidth Γ through Γ = −2ωi. The top axis of each plot marks the frequencies corresponding to the critical latitudes 30°, 50°, and 70° (this is not a statement about the latitude of maximum power). The three branches for the A, P, and S families are highlighted with different colors (see Mack 1976, for a comparison with the spectrum of the Orr-Sommerfeld equation). The modes denoted R, R1, and R2 are closest to the traditional r modes with ℓ = m, ℓ = m + 1, and ℓ = m + 2, respectively (see, e.g., Saio 1982). The denomination of the modes in the solar case (bottom panels) was obtained by tracking the modes from the N = 2 case (top panels). See the evolution between the two profiles in the online movies for m = 1 and m = 2.
Current usage metrics show cumulative count of Article Views (full-text article views including HTML views, PDF and ePub downloads, according to the available data) and Abstracts Views on Vision4Press platform.
Data correspond to usage on the plateform after 2015. The current usage metrics is available 48-96 hours after online publication and is updated daily on week days.
Initial download of the metrics may take a while.