Fig. 1.
Download original image
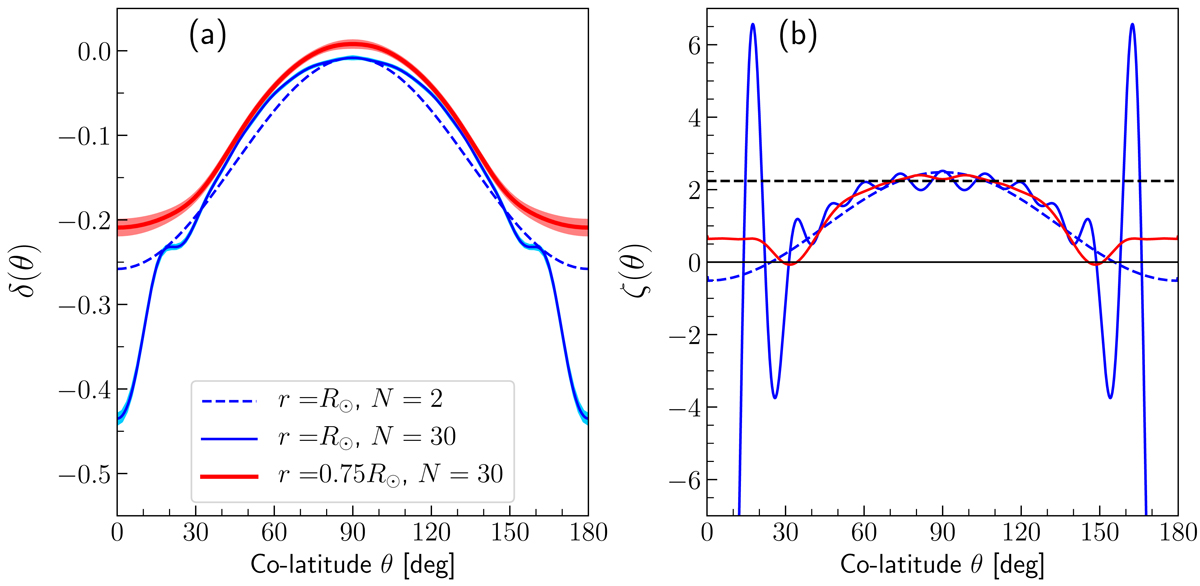
Main quantities entering in the eigenvalue problem defined by Eq. (12). (a) Normalized solar differential rotation rate δ(θ) at different radii, inferred from helioseismology and averaged over 1996 to 2018 (the shaded area covers ±3σ), with respect to the Carrington rotation rate, Ωref = ΩCarr. The solid curves show the N = 30 fits to the solar rotation rates. The dashed curve shows the N = 2 fit to the solar surface rotation rate, i.e., Ω0 + Ω2cos2θ with Ω0/2π = 452 nHz and Ω2/2π = −114 nHz. (b) The function ζ defined by Eq. (9) is plotted for each of the three cases of panel (a). For r = R⊙ and N = 30, the function reaches a minimum at ζ(θ = 0)≈ − 22 (not shown on the plot). The oscillations at the surface are due to the m = 0 zonal flows (also known as torsional oscillations). The horizontal dashed-black line shows ![]() , where β = 2Ωref/r, which plays the role of ζ in the equatorial β plane (see Eq. (17) in Gizon et al. 2020).
, where β = 2Ωref/r, which plays the role of ζ in the equatorial β plane (see Eq. (17) in Gizon et al. 2020).
Current usage metrics show cumulative count of Article Views (full-text article views including HTML views, PDF and ePub downloads, according to the available data) and Abstracts Views on Vision4Press platform.
Data correspond to usage on the plateform after 2015. The current usage metrics is available 48-96 hours after online publication and is updated daily on week days.
Initial download of the metrics may take a while.