Fig. 4.
Download original image
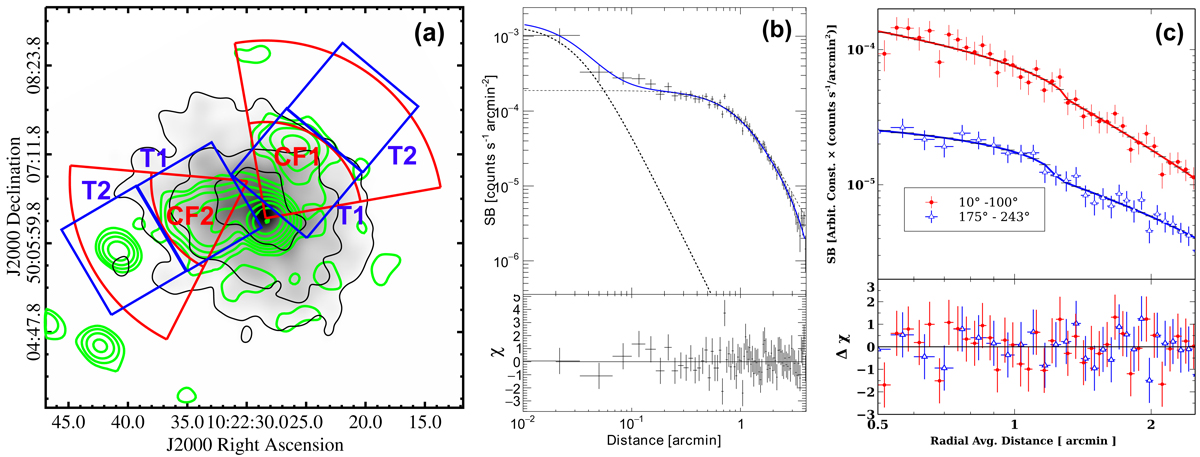
Various X-ray properties of cluster A980. Panel a: Chandra X-ray map in gray and black contours, over-plotted with the GMRT 325 MHz (low-resolution) contours (green). The sectors (10° −100° (CF1) and 175°–243°(CF2)) along which sources B and A are extended, respectively, are marked as red cones. Blue boxes denote the pre- and post-cold-front regions (T2 and T1, respectively) (see text). Panel b: azimuthally averaged X-ray surface brightness (SB) profile, with the best-fit double β-model. The individual β-models are shown with dotted lines and the residuals are shown in the bottom panel. Panel c: SB profiles for the two conal sectors and the fitted broken power-law models are shown with red and blue curves, respectively.
Current usage metrics show cumulative count of Article Views (full-text article views including HTML views, PDF and ePub downloads, according to the available data) and Abstracts Views on Vision4Press platform.
Data correspond to usage on the plateform after 2015. The current usage metrics is available 48-96 hours after online publication and is updated daily on week days.
Initial download of the metrics may take a while.