Open Access
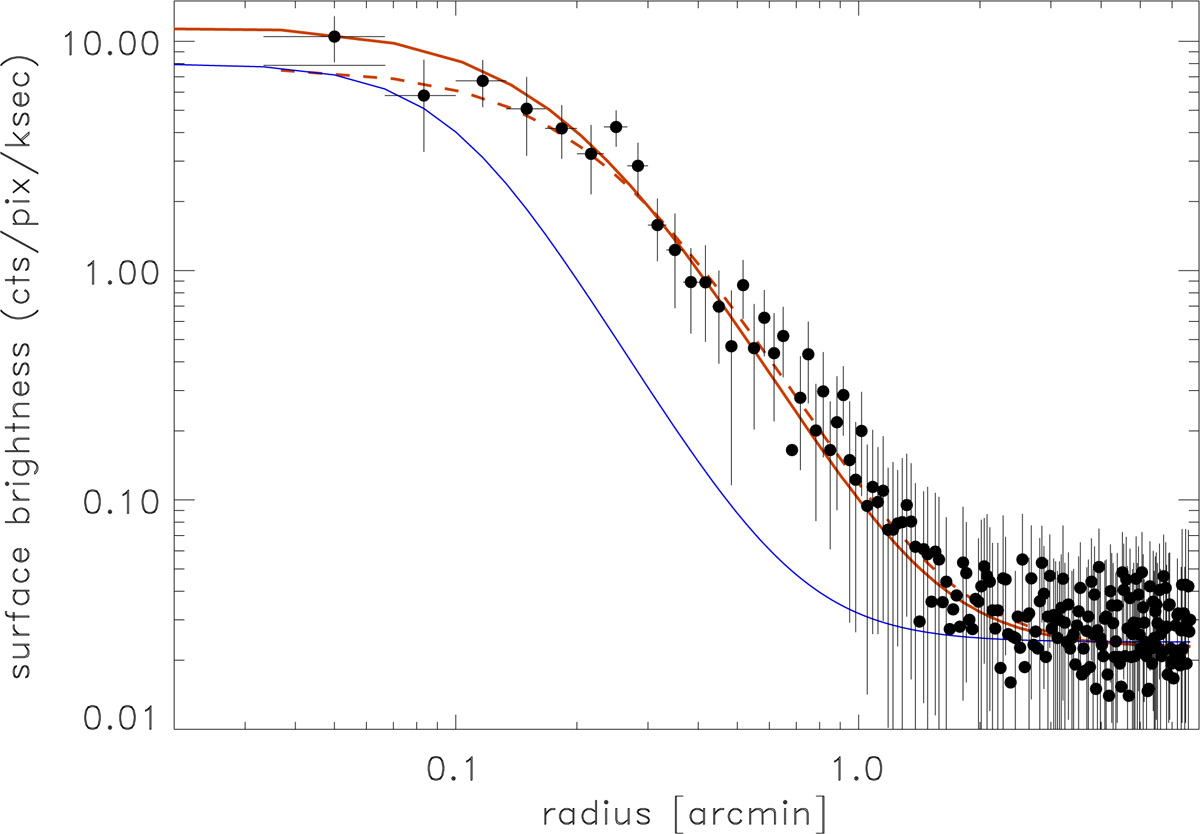
Fig. 13.
Download original image
X-ray surface brightness profile in the 0.5–2 keV band of RXCJ1717.1+2931. The dashed red line shows the best fit of a β model convolved with the point spread function to the observed profile. The solid red line shows the unconvloved profile and the solid blue line shows the profile of a point source.
Current usage metrics show cumulative count of Article Views (full-text article views including HTML views, PDF and ePub downloads, according to the available data) and Abstracts Views on Vision4Press platform.
Data correspond to usage on the plateform after 2015. The current usage metrics is available 48-96 hours after online publication and is updated daily on week days.
Initial download of the metrics may take a while.