Fig. 6
Download original image
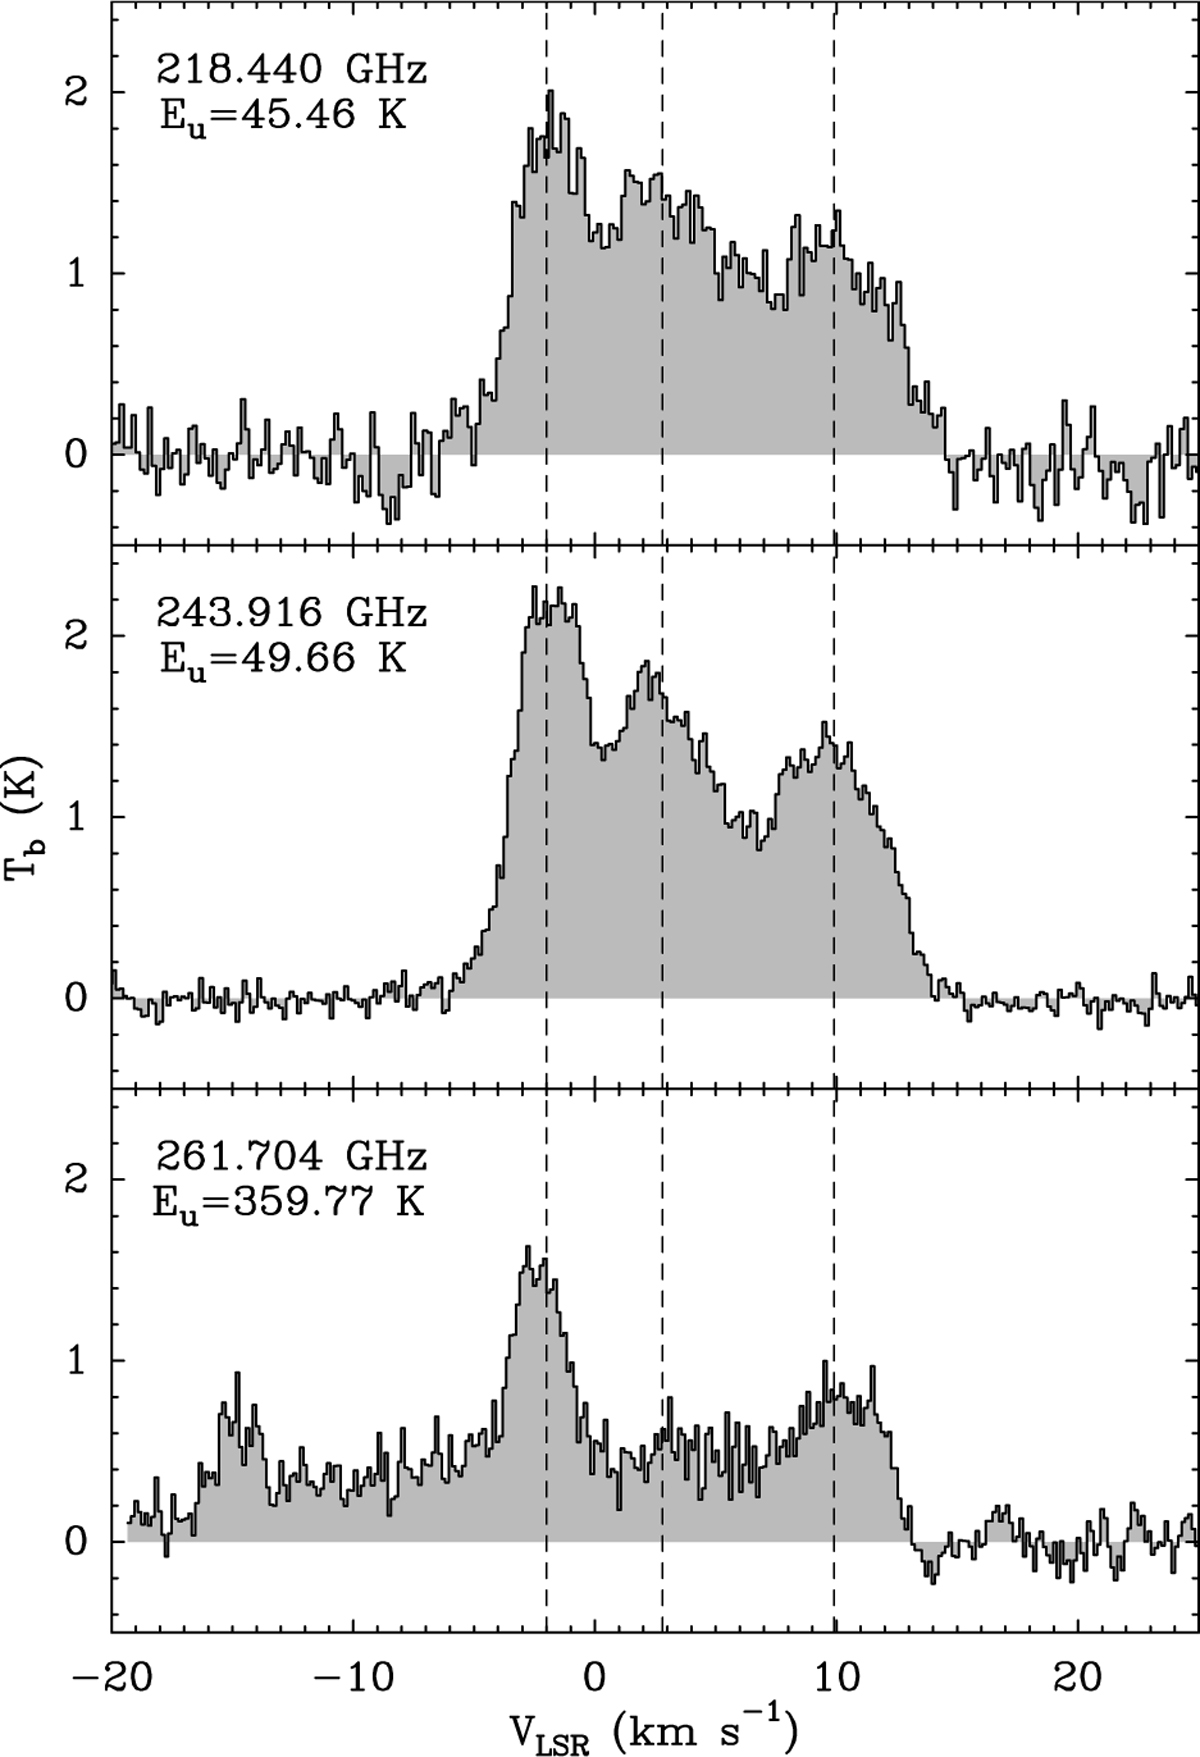
Tb (K) spectra for the high spectral resolution Methanol transitions at 218.440, 243.916, and 261.704 GHz. The dashed lines correspond to the results of the best-fit Gaussian at −2 km s−1, 2.8 km s−1, and 9.9 km s−1. The −2 km s−1 component of the 261.704 GHz transition is blended with a transition of methyl formate (see text).
Current usage metrics show cumulative count of Article Views (full-text article views including HTML views, PDF and ePub downloads, according to the available data) and Abstracts Views on Vision4Press platform.
Data correspond to usage on the plateform after 2015. The current usage metrics is available 48-96 hours after online publication and is updated daily on week days.
Initial download of the metrics may take a while.