Fig. 2
Download original image
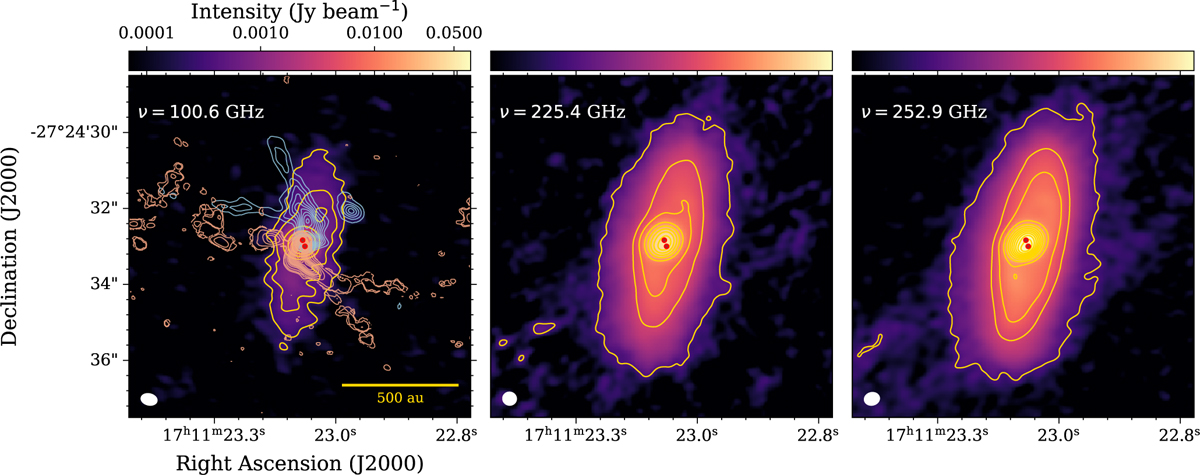
Dust continuum maps obtained in each setup. The rms noise level is 50 μJy beam−1 for Band 3 observations (setup 3, left panel), 90 μJy beam−1 for setup 1 in Band 6 (middle panel), and 70 μJy beam−1 for setup 2 in Band 6 (right panel). The intensity contour levels in the left panel are −5, 5, 10, 30, 50, 70, and 90 × the noise level, while the intensity contours in the middle and right panels are −5, 5, and 50 and from 100 to 1000 (in steps of 100) × 70 μJy beam−1 the noise level in setup 2. The colour scale at the top is the same for all panels. The red dots indicate the positions of 11A (north) and 11B (south) as reported by Alves et al. (2019). The sources are not resolved with the present resolution. The left panel also shows the integrated intensity contours from CO (2 → 1) emission from the bipolar outflow powered by [BHB2007] 11 (Alves et al. 2017). The synthesised beam is displayed in the bottom left corner of each panel (0.36″ × 0.34″, 0.39″ × 0.33″ and 0.42″ × 0.29″ for setups 3, 1, and 2, respectively).
Current usage metrics show cumulative count of Article Views (full-text article views including HTML views, PDF and ePub downloads, according to the available data) and Abstracts Views on Vision4Press platform.
Data correspond to usage on the plateform after 2015. The current usage metrics is available 48-96 hours after online publication and is updated daily on week days.
Initial download of the metrics may take a while.