Fig. 18
Download original image
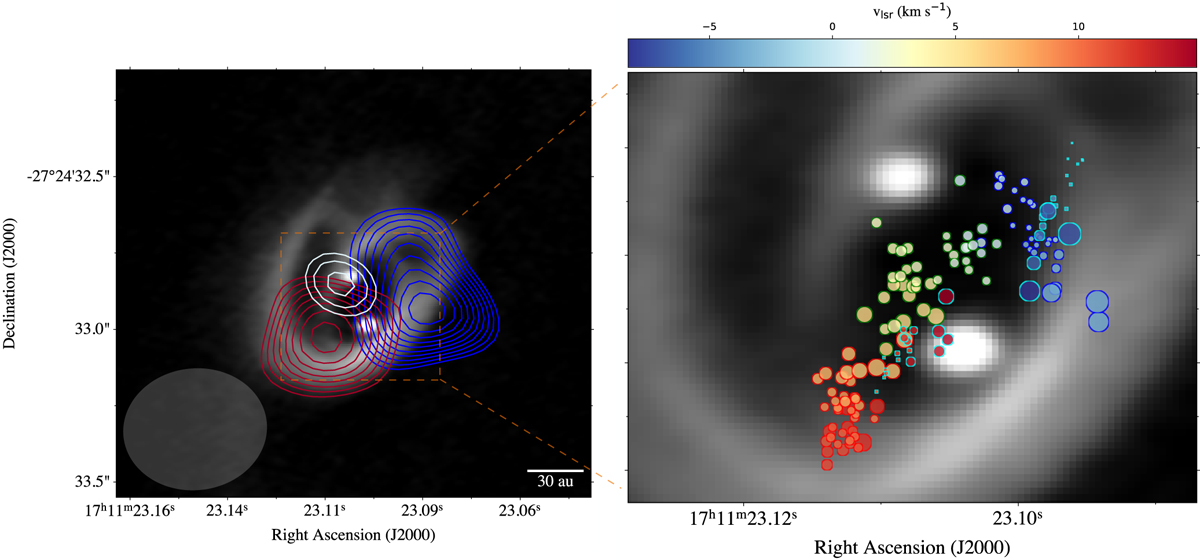
Analysis of the origin of the observed methanol components. Left panel: methanol intensity contours at 243.916 GHz plotted over the dust continuum map of Alves et al. (2019). The contours show the methanol emission at extreme velocity channels detected at a 3σ level (1er = 1.8 mJy beam−1). The blue and red contours correspond to emission at the −4.89 kms−1 and 13.3 kms−1 velocity channels, respectively. White contours show emission (from a 20σ level) from velocity channels near the systemic velocity of the source (2.91 km s−1). The synthesised beam of the methanol (FAUST) data is shown in the lower left corner. Right panel: position of intensity peaks (circles) from the 2D Gaussian fit in each velocity channels separated by ~0.15 km s−1. Colour code for the edges of the circle: red for the 9.9 km s−1 methanol component, green for the 2.8 km s−1 methanol component, and blue for the −2 km s−1 methanol component, while the CO (2–1) high-velocity components are in cyan. The circle size is defined by the uncertainty on the absolute position of the emission peak in each velocity component (largest circle has ~0.02″).
Current usage metrics show cumulative count of Article Views (full-text article views including HTML views, PDF and ePub downloads, according to the available data) and Abstracts Views on Vision4Press platform.
Data correspond to usage on the plateform after 2015. The current usage metrics is available 48-96 hours after online publication and is updated daily on week days.
Initial download of the metrics may take a while.