Fig. 15
Download original image
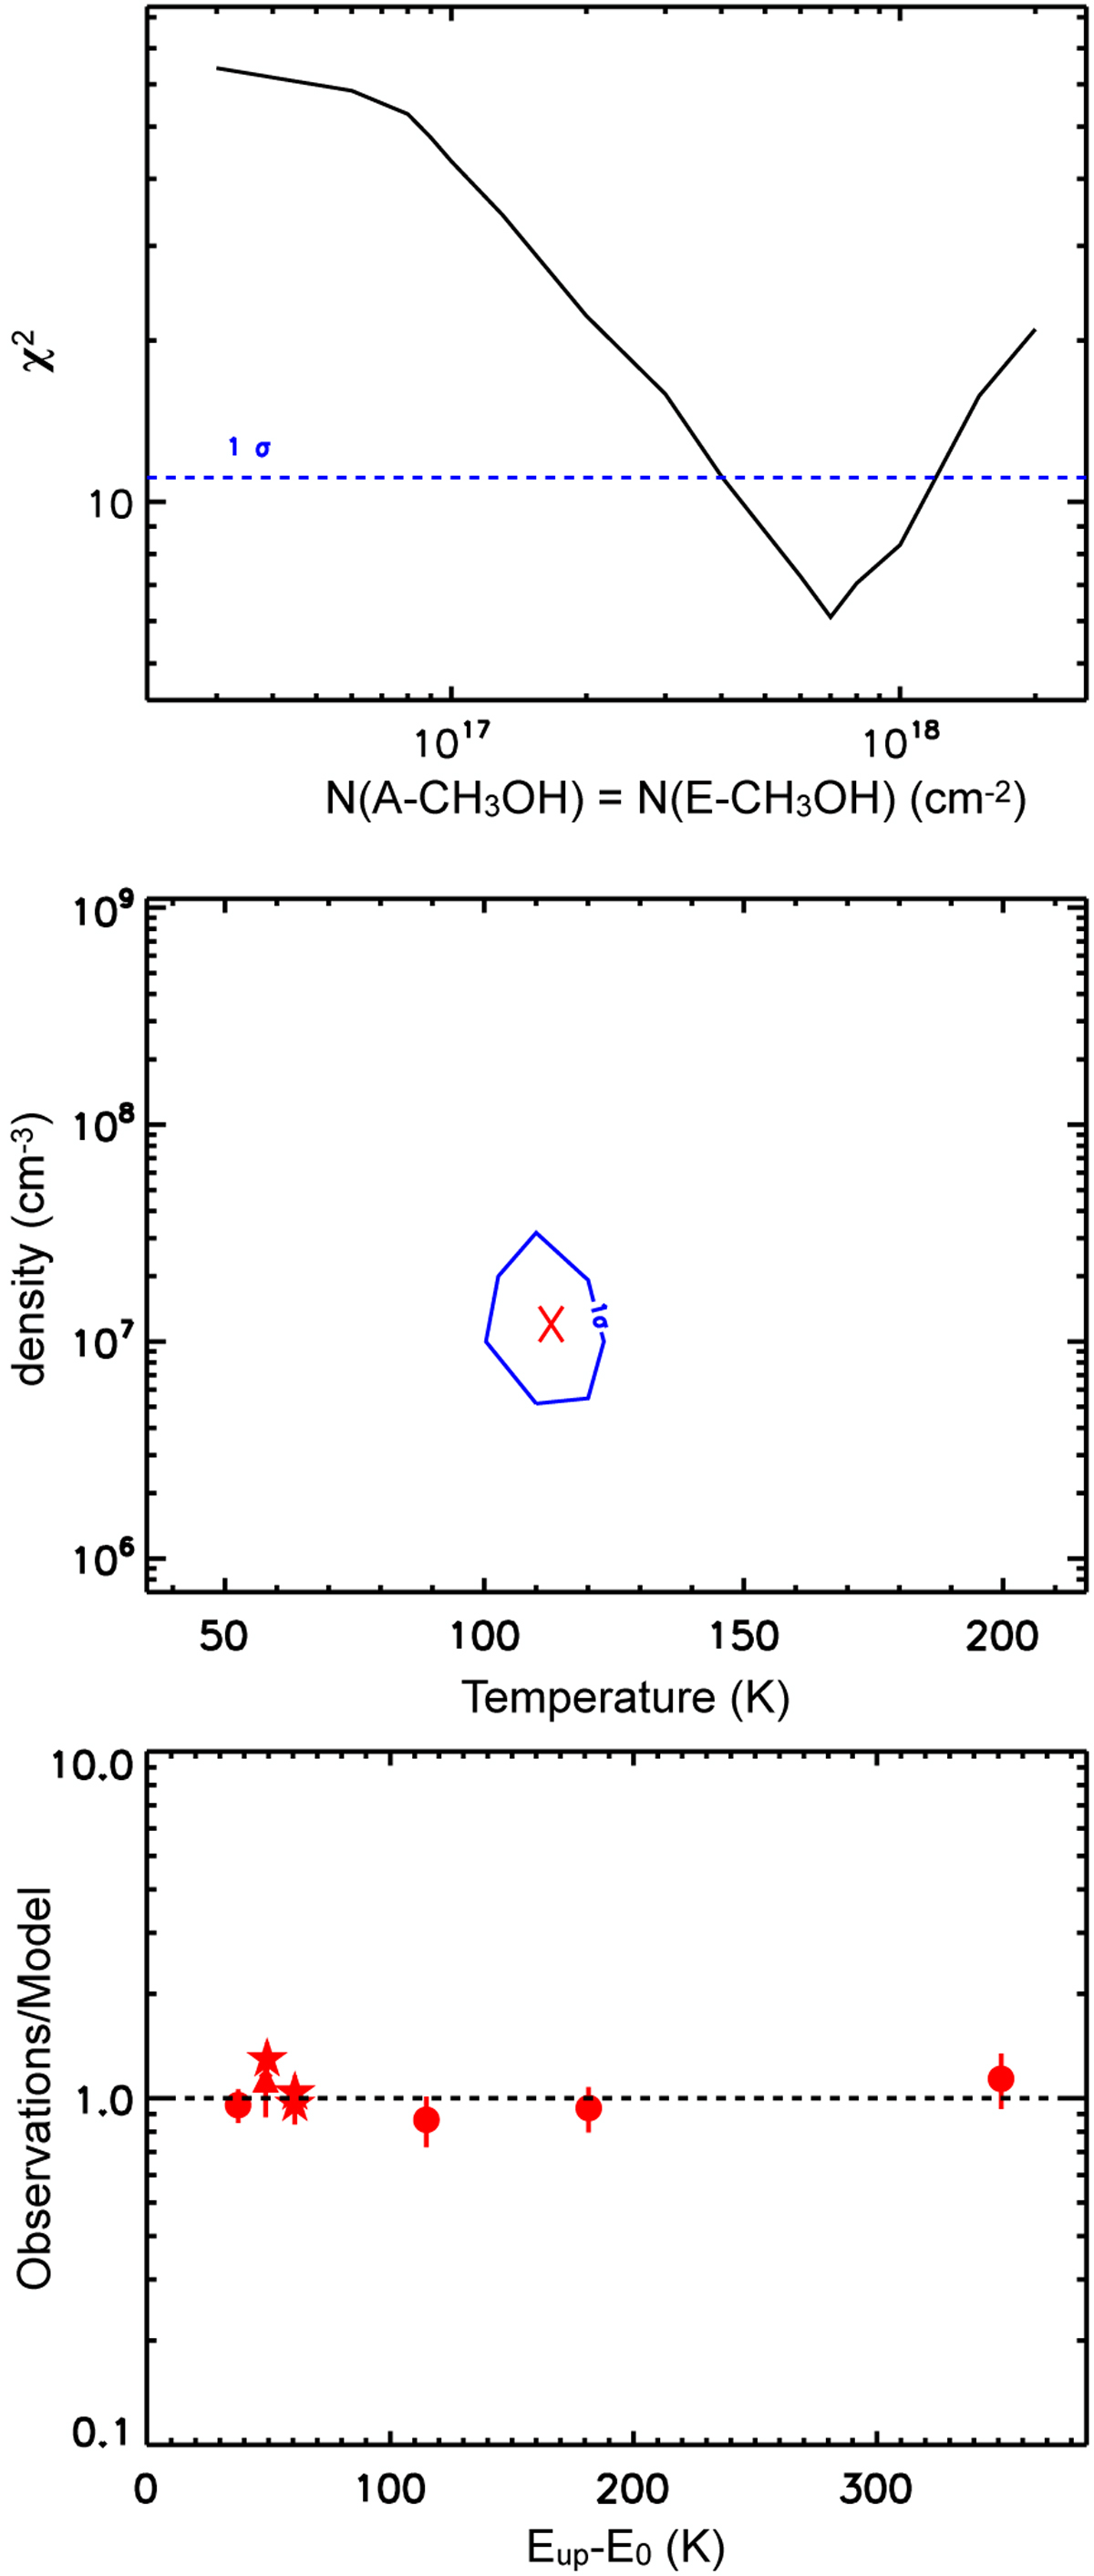
Results from the non-LTE analysis. Upper panel: results from the χ2 minimisation for the −2 km s−1 component simultaneously fitting the A and E forms with a ratio equal to unity and the 13C E methanol transition with a ratio of 68. The minimum therefore has to be multiplied by two to obtain the A+E forms of methanol. Middle panel: density and temperature range obtained for the best-fit methanol column density of 2 × (7 × 1017) cm−2 and source size of 0.15″. Bottom panel: observed integrated intensities versus modelled ones as a function of the upper energy level value with respect to the lowest value. These are 7.9 K for E methanol (red filled circles) and 0 K for A methanol (red filled stars). The 13C E methanol is represented as a red filled triangle.
Current usage metrics show cumulative count of Article Views (full-text article views including HTML views, PDF and ePub downloads, according to the available data) and Abstracts Views on Vision4Press platform.
Data correspond to usage on the plateform after 2015. The current usage metrics is available 48-96 hours after online publication and is updated daily on week days.
Initial download of the metrics may take a while.