Fig. 10
Download original image
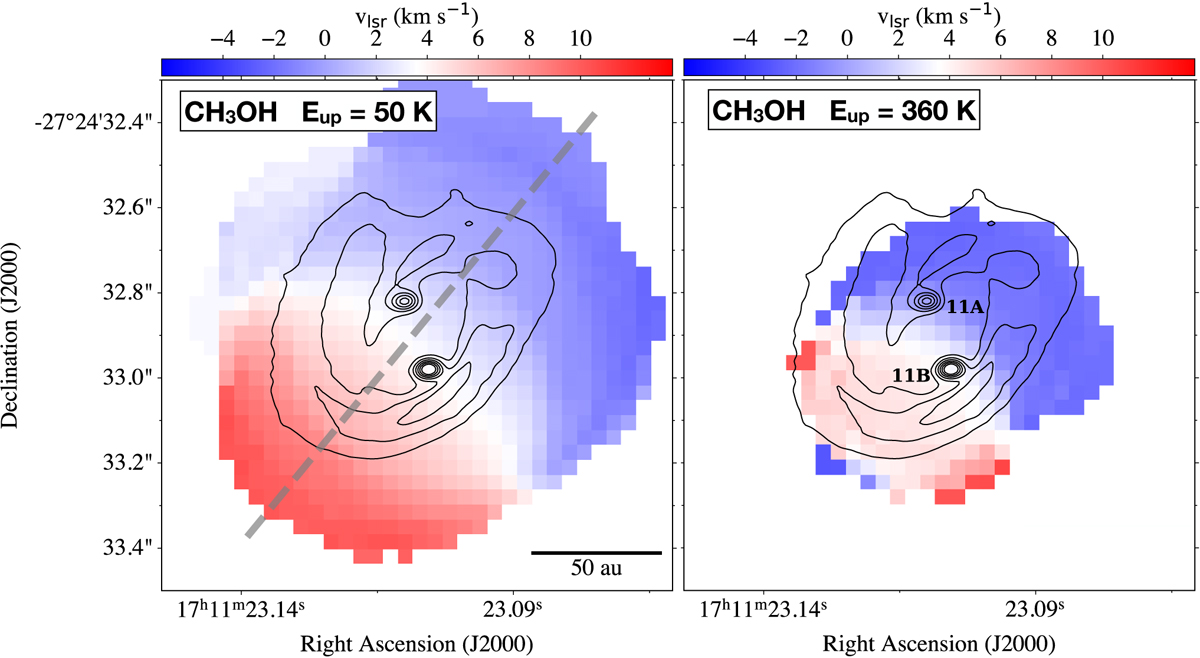
Velocity field determined from methanol transitions at low and high energy levels. The contours indicate the continuum intensity levels from the high spatial resolution observations of Alves et al. (2019). The compact emission contours arise from the circumstellar discs around each protostar of the binary system: 11A (northern component) and 11B (southern component). The dashed line in the left panel shows the direction of the cut used to produce the position-velocity diagram displayed in Fig. 17. The cut position angle is 140° and its width is 0.5″, encompassing both protostars.
Current usage metrics show cumulative count of Article Views (full-text article views including HTML views, PDF and ePub downloads, according to the available data) and Abstracts Views on Vision4Press platform.
Data correspond to usage on the plateform after 2015. The current usage metrics is available 48-96 hours after online publication and is updated daily on week days.
Initial download of the metrics may take a while.