Fig. 2
Download original image
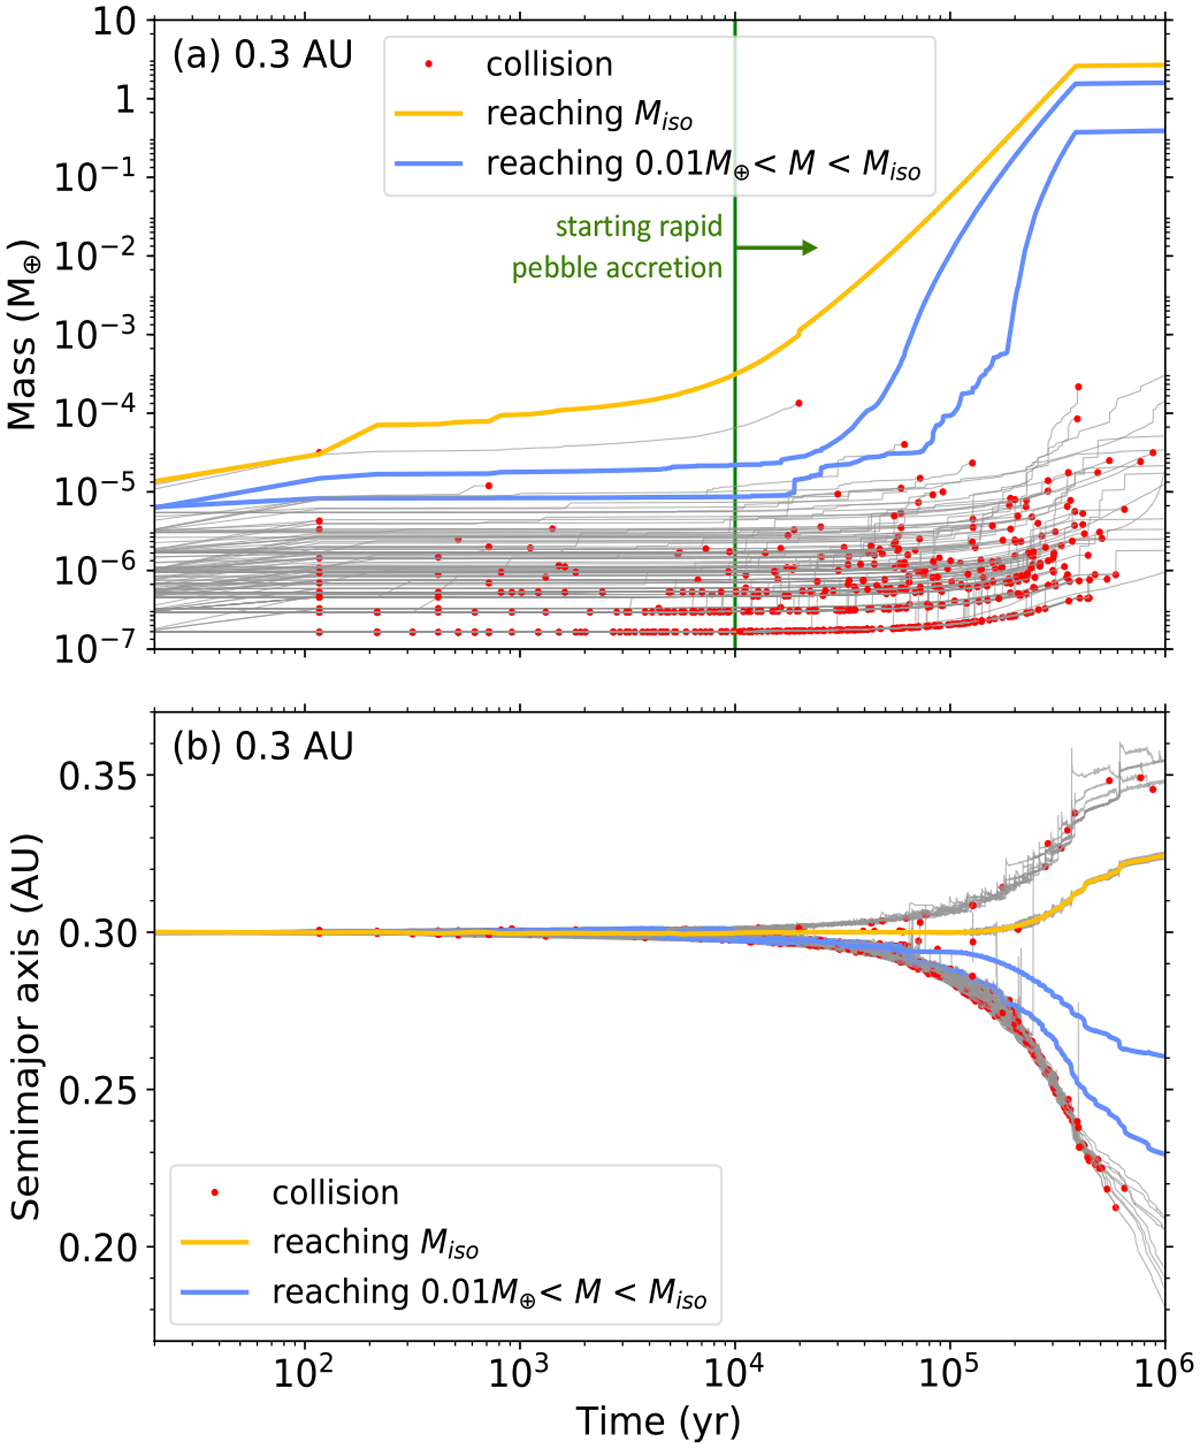
(a) Mass growth and (b) semimajor axis evolution of plan-etesimals in a ring located at r = 0.3 AU. Each line represents one planetesimal and red dots indicate planetesimal-planetesimal collisions. Gray lines represent all planetesimals in the simulation. The yellow and blue lines correspond to the bodies that finally reach the pebble isolation mass, and those that fail to reach the pebble isolation mass but grow above 10−2 M⊕, respectively. The green horizontal line represents the time that large planetesimals start rapid pebble accretion. The mass growth is rapid at close-in orbits for both pebble and planetesimal accretion.
Current usage metrics show cumulative count of Article Views (full-text article views including HTML views, PDF and ePub downloads, according to the available data) and Abstracts Views on Vision4Press platform.
Data correspond to usage on the plateform after 2015. The current usage metrics is available 48-96 hours after online publication and is updated daily on week days.
Initial download of the metrics may take a while.