Fig. 1
Download original image
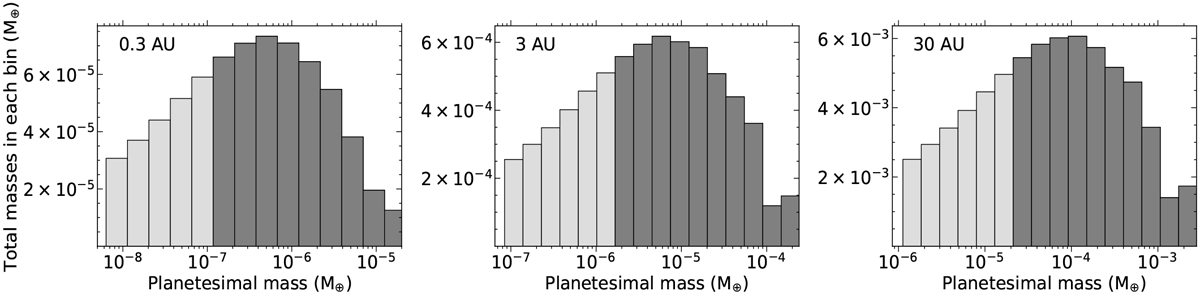
Initial mass distributions of planetesimals generated by streaming instability in a ring belt of the MMSN model at r = 0.3 AU, 3 AU, and 30 AU, respectively. The darker bars represent the population of planetesimals with M > Mplt, which account for two-thirds of the whole population in mass. We only consider the above subset of planetesimals (darker) in the following numerical simulations. At 3 and 30 AU, the last darker bar is higher than the previous bar because the decimal places have been neglected when counting the number of planetesimals. If the number of planetesimals at the mass just less than the maximum mass is higher than one but less than two, it has been treated as one. Thus, the total mass of planetesimals in that bar becomes lower than their last bars.
Current usage metrics show cumulative count of Article Views (full-text article views including HTML views, PDF and ePub downloads, according to the available data) and Abstracts Views on Vision4Press platform.
Data correspond to usage on the plateform after 2015. The current usage metrics is available 48-96 hours after online publication and is updated daily on week days.
Initial download of the metrics may take a while.