Fig. 6.
Download original image
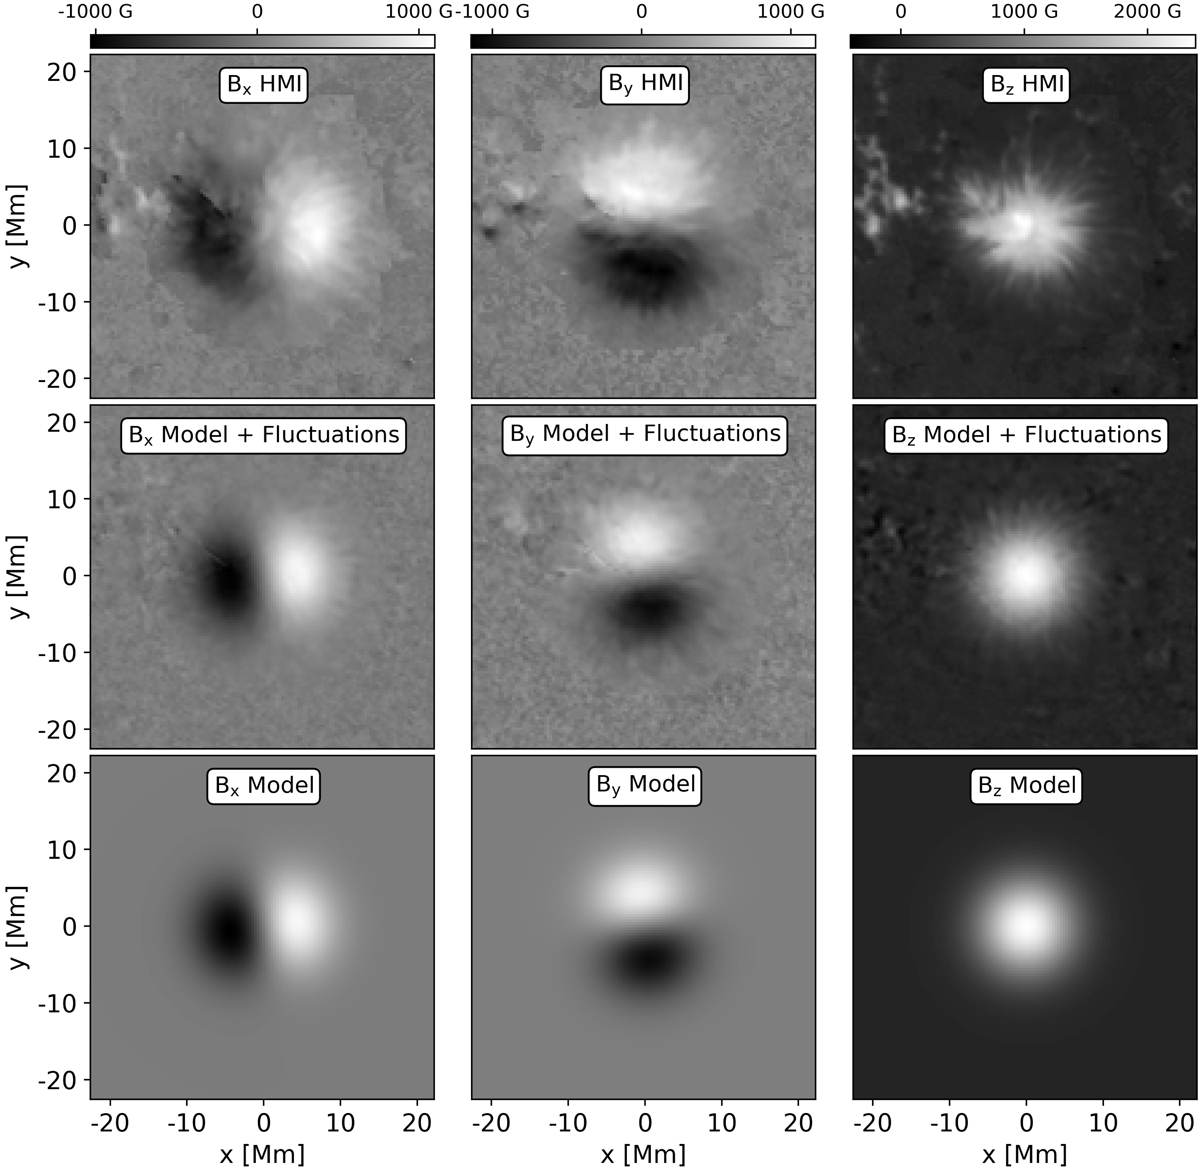
Comparison of the vector components (Bx, By, Bz) of the magnetic field. First row: HMI observation of the leading sunspot of active region NOAA 11072 (2010.05.25 03:00:00 TAI), which serves as the reference for our sunspot model. Second and third rows: model with and without temporal fluctuations, respectively. Every column is plotted on the same scale in units of Gauss displayed by the color bar at the top of the column.
Current usage metrics show cumulative count of Article Views (full-text article views including HTML views, PDF and ePub downloads, according to the available data) and Abstracts Views on Vision4Press platform.
Data correspond to usage on the plateform after 2015. The current usage metrics is available 48-96 hours after online publication and is updated daily on week days.
Initial download of the metrics may take a while.