Open Access
Fig. 5.
Download original image
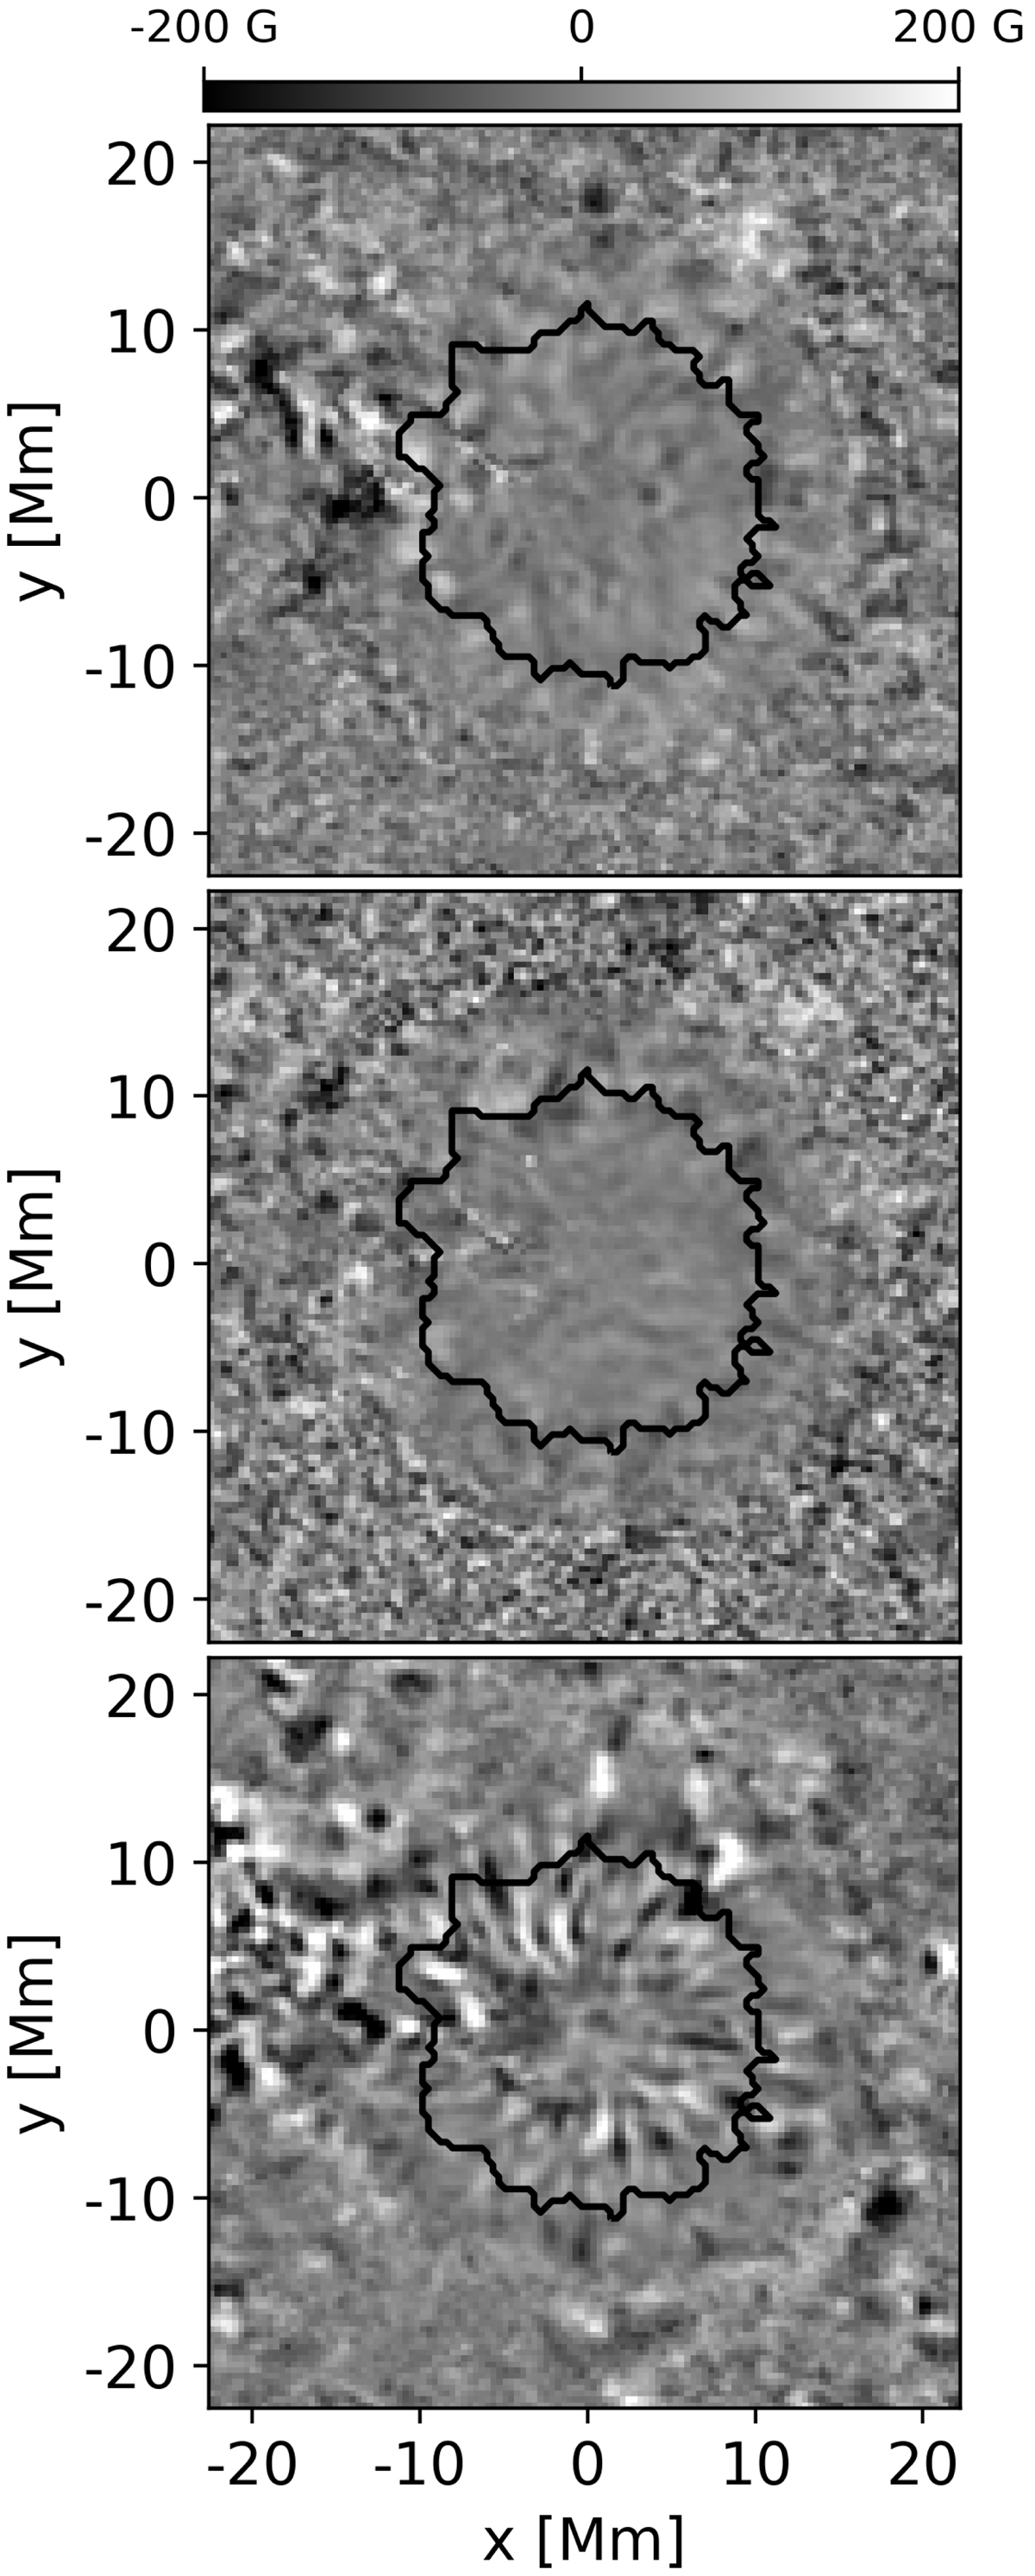
Each panel represents one realization of magnetic field fluctuations for each vector component. All panels are plotted on the same scale in units of Gauss displayed by the color bar at the top. The black solid line represents the observed sunspot boundary.
Current usage metrics show cumulative count of Article Views (full-text article views including HTML views, PDF and ePub downloads, according to the available data) and Abstracts Views on Vision4Press platform.
Data correspond to usage on the plateform after 2015. The current usage metrics is available 48-96 hours after online publication and is updated daily on week days.
Initial download of the metrics may take a while.