Fig. 3.
Download original image
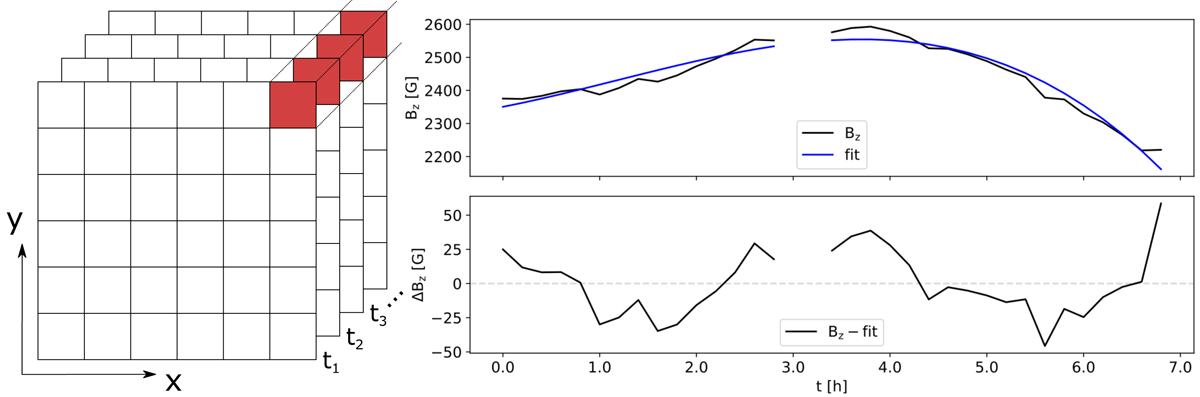
Sketch of the detrending process. A series of consecutive vector magnetograms (e.g., the Bz component) labeled with different time-steps (t1, t2, t3, ...), is shown on the left. The black line (data) in the top right panel represents the temporal evolution of one pixel in this time-series (marked in red in the left panel). The blue line is a third-order polynomial fit to the data. Bottom right panel: detrended time-series, which shows the residuals of the data with respect to the fit.
Current usage metrics show cumulative count of Article Views (full-text article views including HTML views, PDF and ePub downloads, according to the available data) and Abstracts Views on Vision4Press platform.
Data correspond to usage on the plateform after 2015. The current usage metrics is available 48-96 hours after online publication and is updated daily on week days.
Initial download of the metrics may take a while.